 English
  Русский
 Bahasa Indonesia
 Bahasa Malay
 ไทย
ไทย Español
 Deutsch
 Български
 Français
 Tiếng Việt
 中文
中文 বাংলা
বাংলা हिन्दी
 Čeština
 Українська
 Română
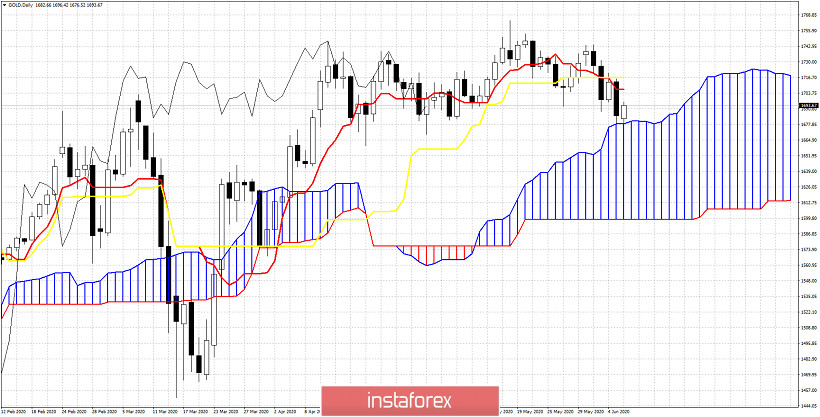
Gold price is bouncing off the Daily Kumo. Price has reached our target and is now bouncing. This is a bullish sign. As long as price is above the Kumo Daily trend is bullish. Gold could now bounce towards $1,715 resistance.
 Relevance until
Gold price is bouncing off the Daily Kumo. Price has reached our target and is now bouncing. This is a bullish sign. As long as price is above the Kumo Daily trend is bullish. Gold could now bounce towards $1,715 resistance.