 English
  Русский
 Bahasa Indonesia
 Bahasa Malay
 ไทย
ไทย Español
 Deutsch
 Български
 Français
 Tiếng Việt
 中文
中文 বাংলা
বাংলা हिन्दी
 Čeština
 Українська
 Română

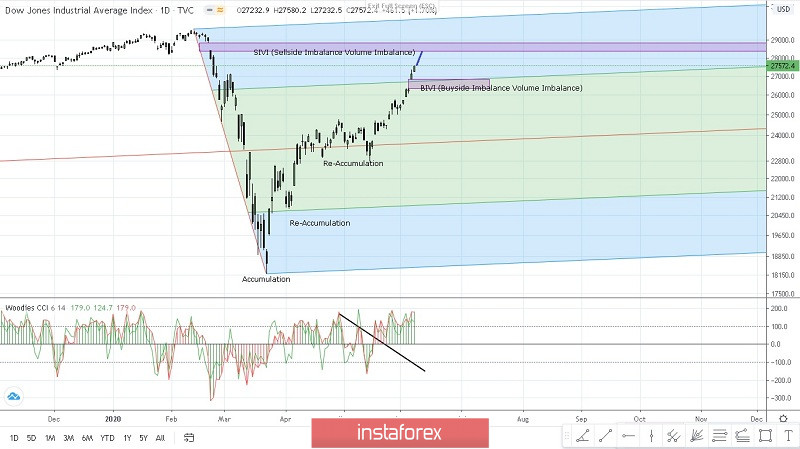
If we look at the daily chart for the #DJI, the index is now trying to fill the SIVI (Sellside Imbalance Volume Imbalance) area (the Magenta Rectangle). From the Technical View, this happen when the Woodies CCI broke out from the ZLR (the Zero Line Reject) roughly at the time after the second Re-Accumulation. Maybe there will be a retracement to the downside, but as long as the price does not break out and closes below 25,000, the Dow Jones Industrial Average Index is set to move in a bullish bias.
(Disclaimer)