 English
  Русский
 Bahasa Indonesia
 Bahasa Malay
 ไทย
ไทย Español
 Deutsch
 Български
 Français
 Tiếng Việt
 中文
中文 বাংলা
বাংলা हिन्दी
 Čeština
 Українська
 Română

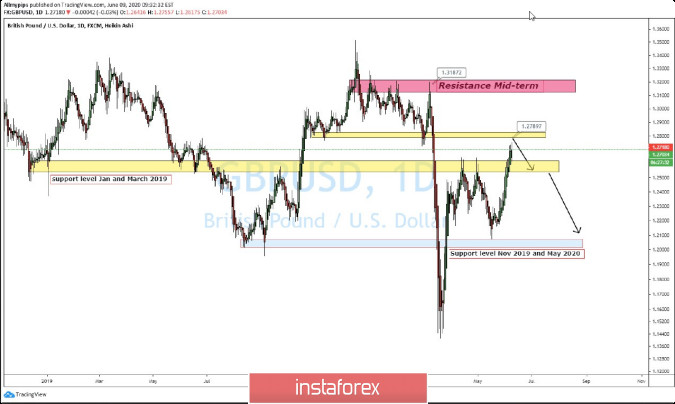 resistance is seen at the level of 1.3518.
SUPPORT/RESISTANCE Weekly Base
S1= 1.2450S2=1.2210R1=1.2830R2=1.3240
The key long-term technical resistance is seen at the level of 1.3518. Only if one of these levels is clearly violated, the main trend might reverse (1.3518) or accelerate (1.1404).