 English
  Русский
 Bahasa Indonesia
 Bahasa Malay
 ไทย
ไทย Español
 Deutsch
 Български
 Français
 Tiếng Việt
 中文
中文 বাংলা
বাংলা हिन्दी
 Čeština
 Українська
 Română

EURUSD remains in a bearish trend. Price is vulnerable to a move towards 1.1175-1.1135. We focus on the lower lows and lower highs pattern and on the trend line resistance of the RSI. Both point to a move lower.
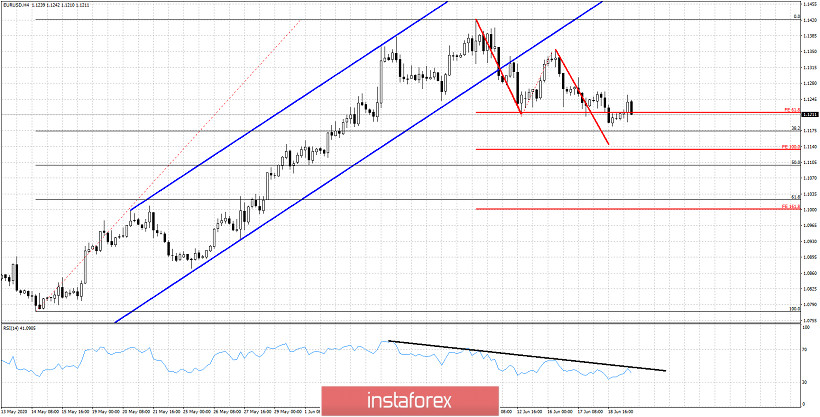
Black line- RSI resistance
Red lines - expected path
EURUSD was expected to pull back towards the 38% Fibonacci retracement. EURUSD has potential to move towards the 100% extension of the first leg down, towards the 50% retracement. As long as price is below 1.1260 and as long as the RSI is below the black trend line, we remain bearish.