 English
  Русский
 Bahasa Indonesia
 Bahasa Malay
 ไทย
ไทย Español
 Deutsch
 Български
 Français
 Tiếng Việt
 中文
中文 বাংলা
বাংলা हिन्दी
 Čeština
 Українська
 Română

In a previous analysis we noted the bullish pennant pattern BTCUSD was in and that we would get a bullish signal if price were to break above $9,500. BTCUSD is now giving us bullish signals and support is found at $8,980.
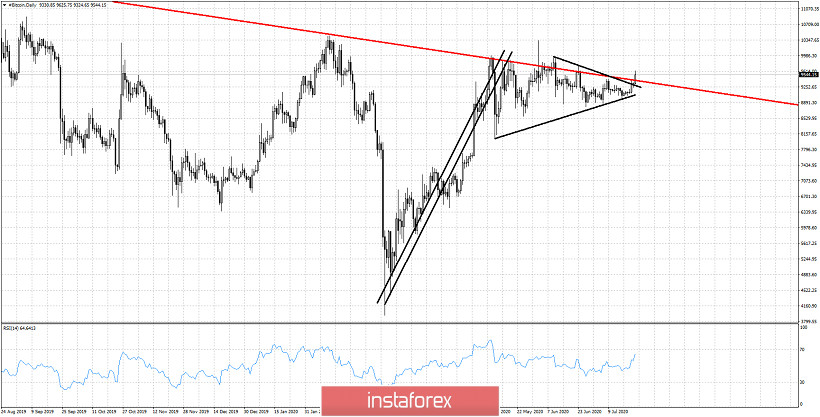
Red line - long-term resistance
BTCUSD is breaking to the upside. This is a bullish signal. Price should start rising and making higher highs and higher lows. This bullish signal is canceled if price pulls back below $8,890. Important signs to look for. If price now breaks above the horizontal resistance level of $9,850, then bulls have confirmation of the break out. A rejection and reversal at $9,850 would be a bad sign. First step has been made by bulls. They need now to defend the support and break above the next resistance level.