 English
  Русский
 Bahasa Indonesia
 Bahasa Malay
 ไทย
ไทย Español
 Deutsch
 Български
 Français
 Tiếng Việt
 中文
中文 বাংলা
বাংলা हिन्दी
 Čeština
 Українська
 Română

Further Development
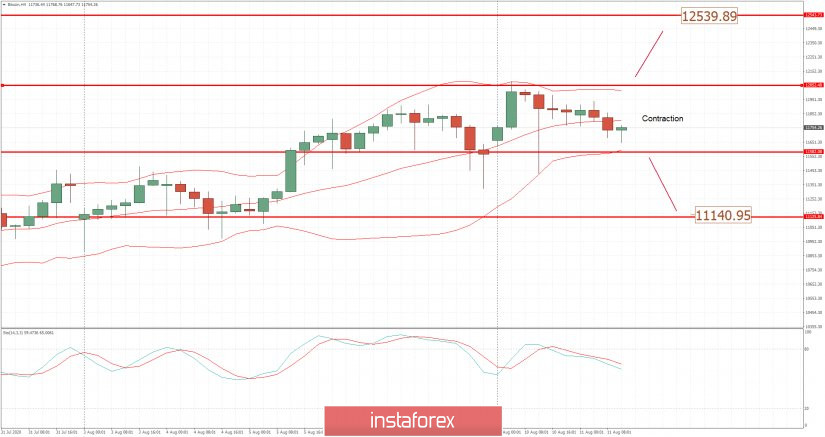
Analyzing the current trading chart, I found that the BTC is in contraction and sideways mode between the resistance at $12,050 and support at the price of $11,580.
I would watch for the breakout of support or resistance to confirm further direction.
The upside breakout of resistance at $12,050 can lead us to test $12,500
The downside breakout of the support at $11,582 can lead us to the test of $11,150
Key Lvels:
Pivot support: $11,580
Resistance level: $12,050