English
  Русский
 Bahasa Indonesia
 Bahasa Malay
 ไทย
ไทย Español
 Deutsch
 Български
 Français
 Tiếng Việt
 中文
中文 বাংলা
বাংলা हिन्दी
 Čeština
 Українська
 Română

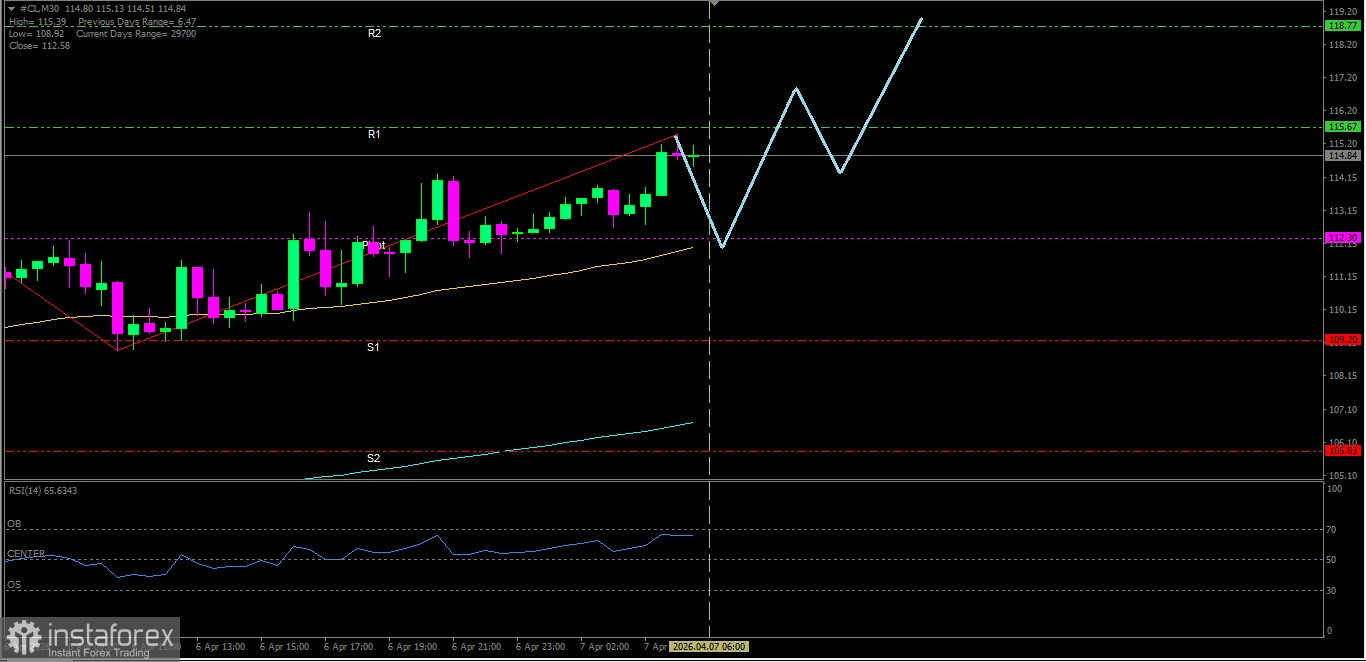
[Crude Oil]
With both EMAs condition forming a Golden Cross intersection and supported by RSI(14) indicator which is in the Neutral-Bullish level, then there is potential in the near term for #CL to test its nearest resistance level.
Key Levels
1. Resistance. 2 : 118.77
2. Resistance. 1 : 115.67
3. Pivot : 112.30
4. Support. 1 : 109.20
5. Support. 2 : 105.83
Tactical Scenario
Positive Reaction Zone: If the price holds and does not break below 112.30, there is a likelihood of an advance toward 115.67.
Momentum Extension Bias: If 115.67 is broken, Crude Oil could continue higher to test 118.77.
Invalidation Level / Bias Revision
The upside bias weakens if #CL falls and closes below 105.83.
Technical Summary
EMA(50) : 112.03
EMA(200): 106.71
RSI(14) : 66.10
Economic News Release Agenda:
Today the United States will release the following economic data:
US - ADP Weekly Employment Change - 19:15 WIB
US - Core Durable Goods Orders m/m - 19:30 WIB
US - Durable Goods Orders m/m - 19:30 WIB
US - RCM/TIPP Economic Optimism - tentative
US - Consumer Credit m/m - 02:00 WIB
US - API Weekly Statistical Bulletin - 03:30 WIB