 English
  Русский
 Bahasa Indonesia
 Bahasa Malay
 ไทย
ไทย Español
 Deutsch
 Български
 Français
 Tiếng Việt
 中文
中文 বাংলা
বাংলা हिन्दी
 Čeština
 Українська
 Română

4h
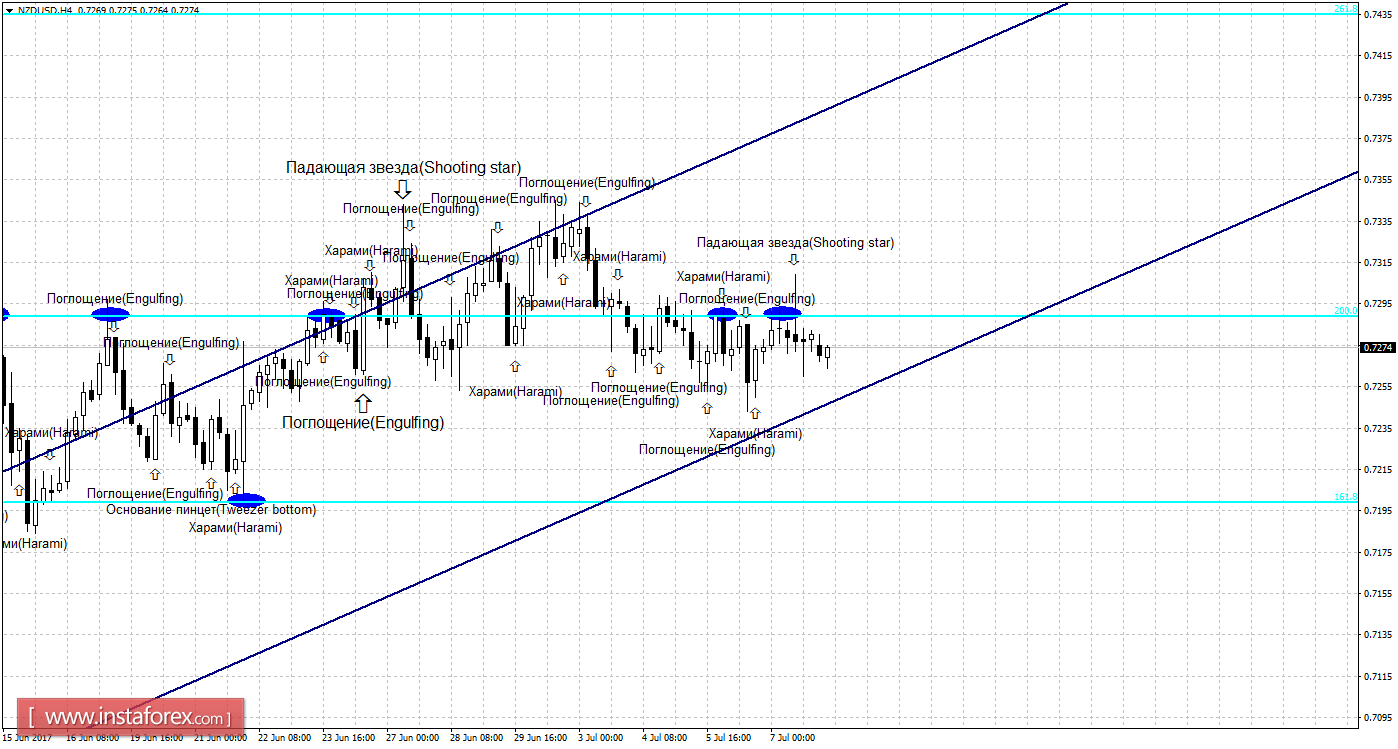
The bear formation of the "Falling Star" and the release of quotations from the Fibo level of 200.0% - 0.7289 made it possible to turn in favor of the US dollar and begin a decline in the direction of the correction level of 161.8% - 0.7199. The formation of a bull candle on July 10 will allow traders to expect the pair to turn in favor of the New Zealand currency and return to the Fibo level of 200.0%. Such a formation will be identified as a trend, based on the direction of the equidistant channel. Strengthening the rate above the correction level of 200.0% will increase the chances for further growth in the direction of the next Fibo level of 261.8% - 0.7435.
The Fibo grid is built on extremes from April 24, 2017 and May 11.
Daily
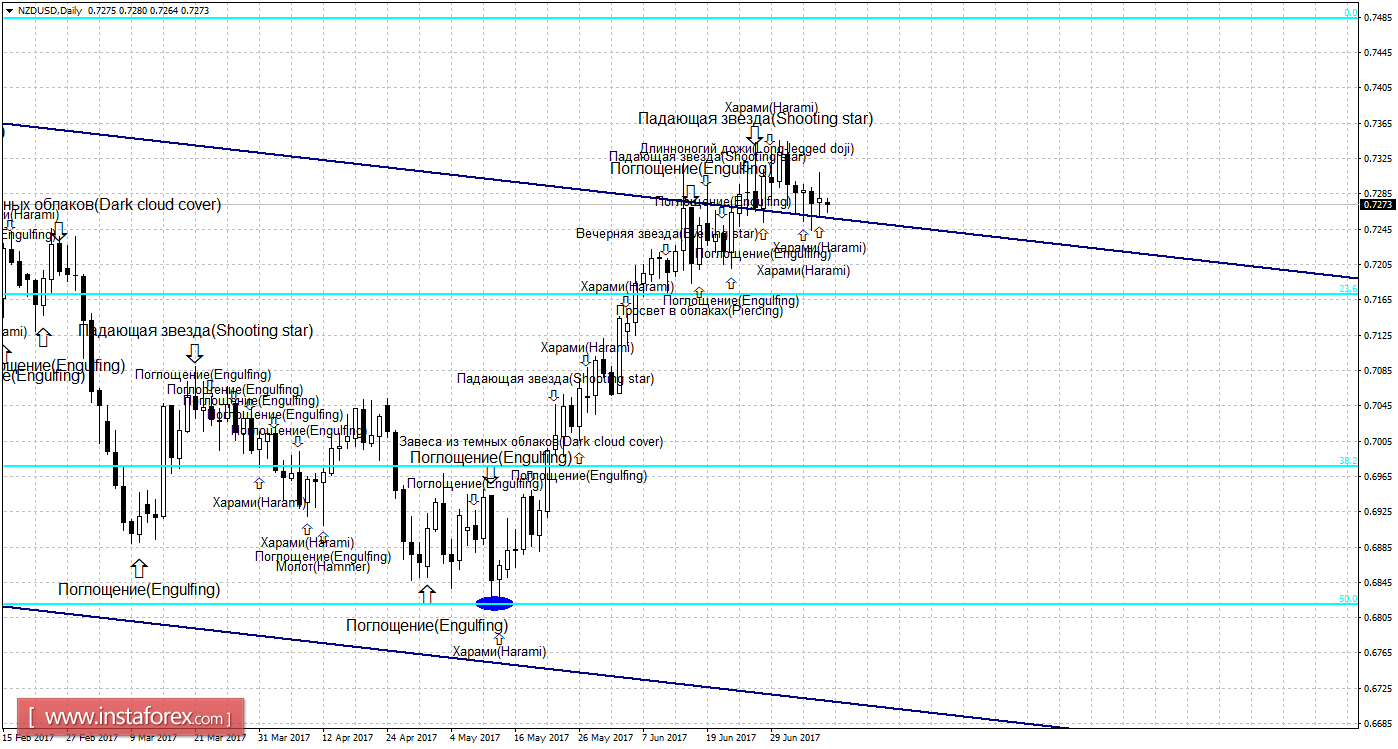
Another bovine candlestick formation "Harami", formed on a 24-hour chart, suspended the drop in quotations for a while. Passing a pair of low "Harami" or a bear formation will allow the expected continuation of the fall of quotations in the direction of the corrective level of 23.6% - 0.7172. "Harami" can also work in favor of the New Zealand currency, but so far no reversal. The formation of a new, stronger, bullish formation will again allow us to expect a turn in favor of New Zealand's currency and some growth towards the correction level of 0.0% -0.7483.
The Fibo grid is built on extremes from August 24, 2015 and September 8, 2016.
Specification:
Weak candle formations will be marked by the usual text and the size of the arrows.
Strong candle formations will be marked by a more bold text and a larger size of arrows.