English
  Русский
 Bahasa Indonesia
 Bahasa Malay
 ไทย
ไทย Español
 Deutsch
 Български
 Français
 Tiếng Việt
 中文
中文 বাংলা
বাংলা हिन्दी
 Čeština
 Українська
 Română

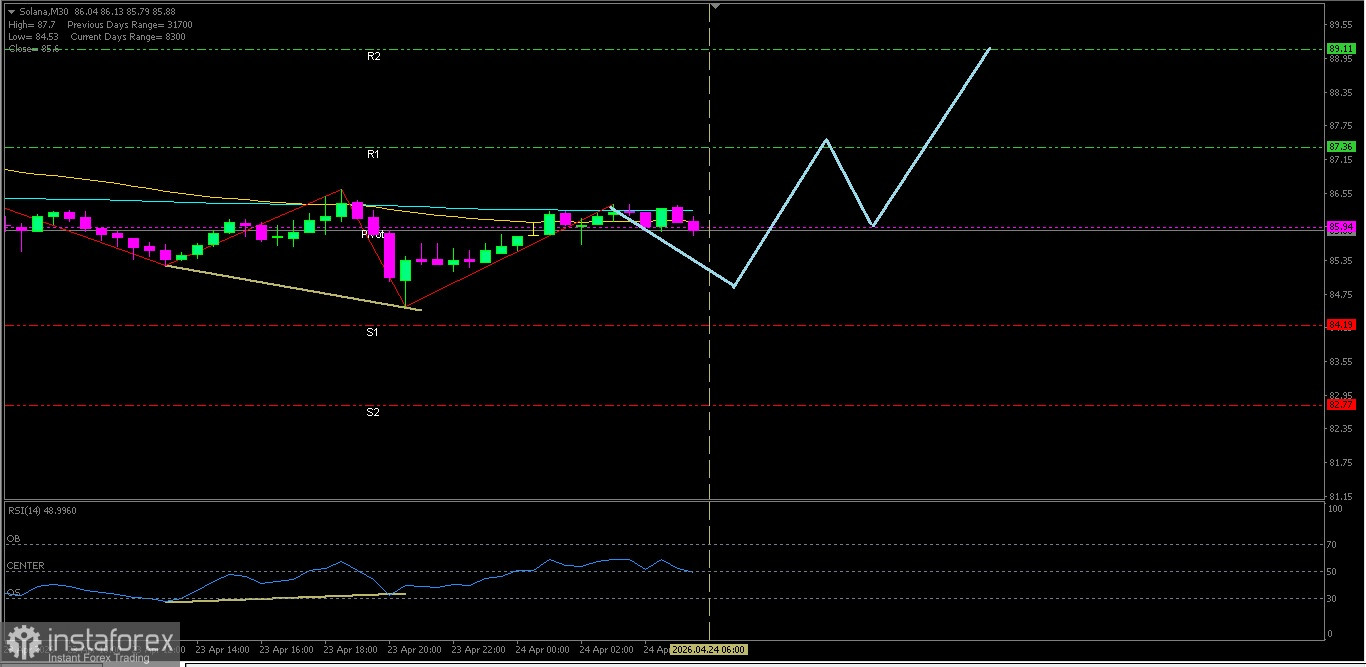
Solana
Although EMA(50) position is below EMA(200), but with RSI(14) condition is in the Neutral-Bullish level and the appearance of a Bullish Divergence, there is potential for Solana to strengthen toward its nearest resistance level.
Key Levels
1. Resistance. 2 : 89.11
2. Resistance. 1 : 87.36
3. Pivot : 85.94
4. Support. 1 : 84.19
5. Support. 2 : 82.77
Tactical Scenario
Positive Reaction Zone: If Solana breaks out above 87.36, there is a likelihood of a move up toward 89.11.
Momentum Extension Bias: If 89.11 is broken, 90.53 becomes the next target.
Invalidation Level / Bias Revision
The upside bias weakens if Solana falls below 82.77.
Technical Summary
EMA(50) : 86.05
EMA(200): 86.24
RSI(14) : 52.31 + Bullish Divergent
Economic News Release Agenda:
From the United States only two economic releases are scheduled:
US - Revised UoM Consumer Sentiment - 21:00 WIB
US - Revised UoM Inflation Expectations - 21:00 WIB