 English
  Русский
 Bahasa Indonesia
 Bahasa Malay
 ไทย
ไทย Español
 Deutsch
 Български
 Français
 Tiếng Việt
 中文
中文 বাংলা
বাংলা हिन्दी
 Čeština
 Українська
 Română

4h
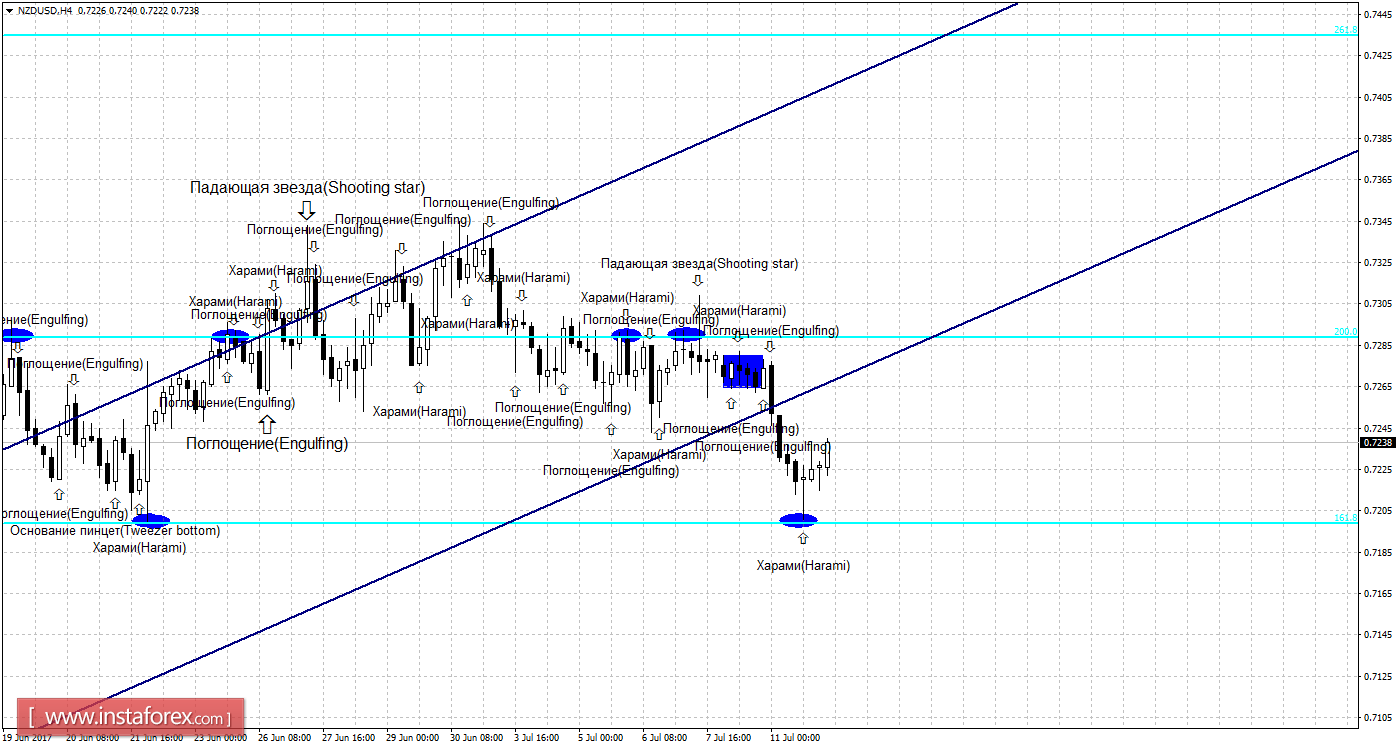
Prices hang up from the correction level of 161.8% to 0.7199 and the formation of bullish Harami candlestick pattern are working in favor of the New Zealand currency.
The expansion started in the direction of the corrective level of 200.0% - 0.7289.
The NZD / USD consolidated below the correction level of 161.8% which will increase chances of further decline in prices towards the next corrective level of 100.0% - 0.7053.
The Fibonacci grid is placed on extremes from April 24, 2017 and May 11, 2017.
Daily
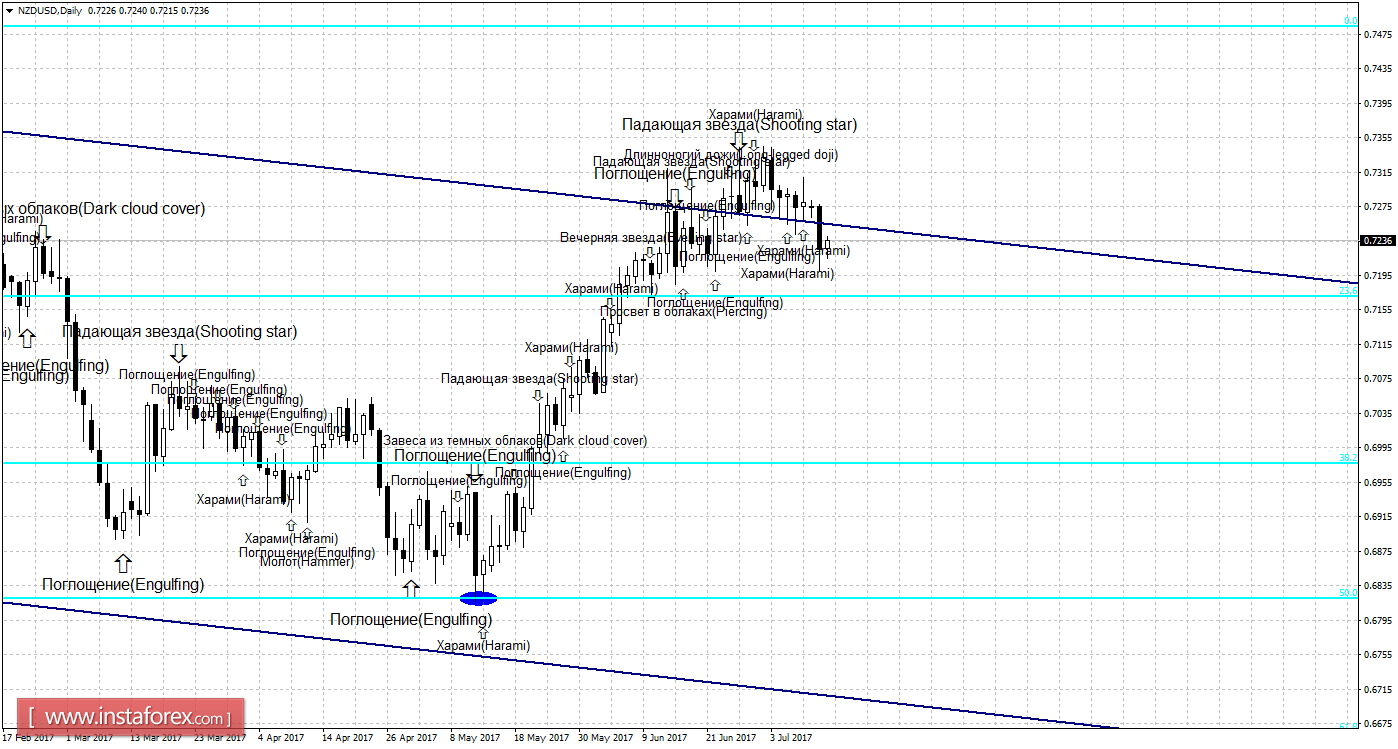
The weakening of the NZD / USD pair continues as shown the 24-hour chart towards the direction of the correction level of 23.6% - 0.7172. The pair's retracement level of 23.6% is expected to allow traders make a move favorable to the New Zealand currency and some development approaching the correction level of 0.0% - 0.7484. The formation of the bullish candle pattern will also work inclined with the initial growth of the pair. The pair consolidated below the Fibo level of 23.6% had increased chances of continuing the decline towards the next correction level of 38.2% - 0.6977.
The Fibonacci grid is located on extremes from August 24, 2015 and September 8, 2016.
Specification:
Weak candle formations will be marked with plain text and a smaller size of arrows.
Strong candle formations will be marked with bold text and a larger size of arrows.