 English
  Русский
 Bahasa Indonesia
 Bahasa Malay
 ไทย
ไทย Español
 Deutsch
 Български
 Français
 Tiếng Việt
 中文
中文 বাংলা
বাংলা हिन्दी
 Čeština
 Українська
 Română

4h
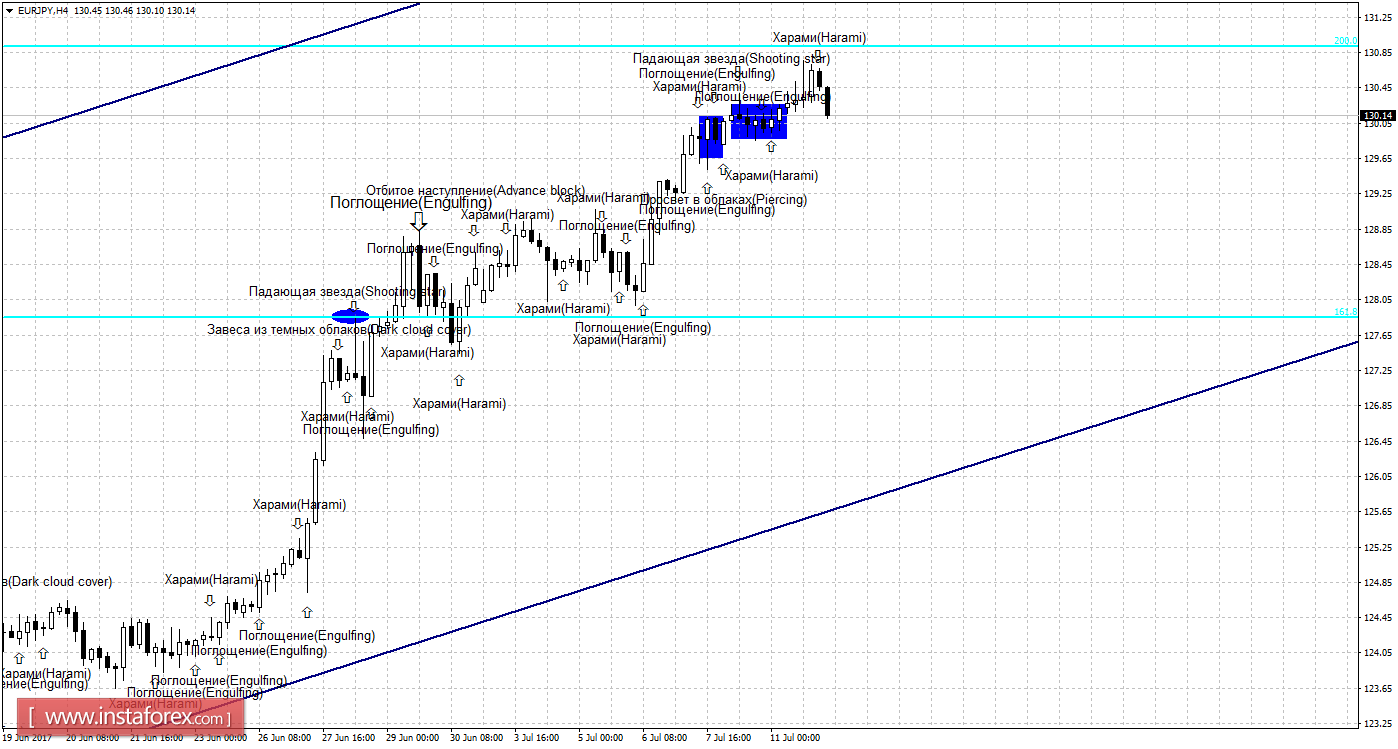
The formation of the bull pattern on July 12 would allow traders to anticipate a trend beneficial for the European currency. The growth will continue through the direction of the correction level of 200.0% - 130.91. Such formation will be recognized as a trend based on the direction of the equidistant channel. Setting the rate above the Fibo level of 200.0% will increase chances of consistent growth towards the next correction level of 261.8% - 135.91.
The Fibonacci grid is established on the upper limits of March 13, 2017 and April 17, 2017.
Daily
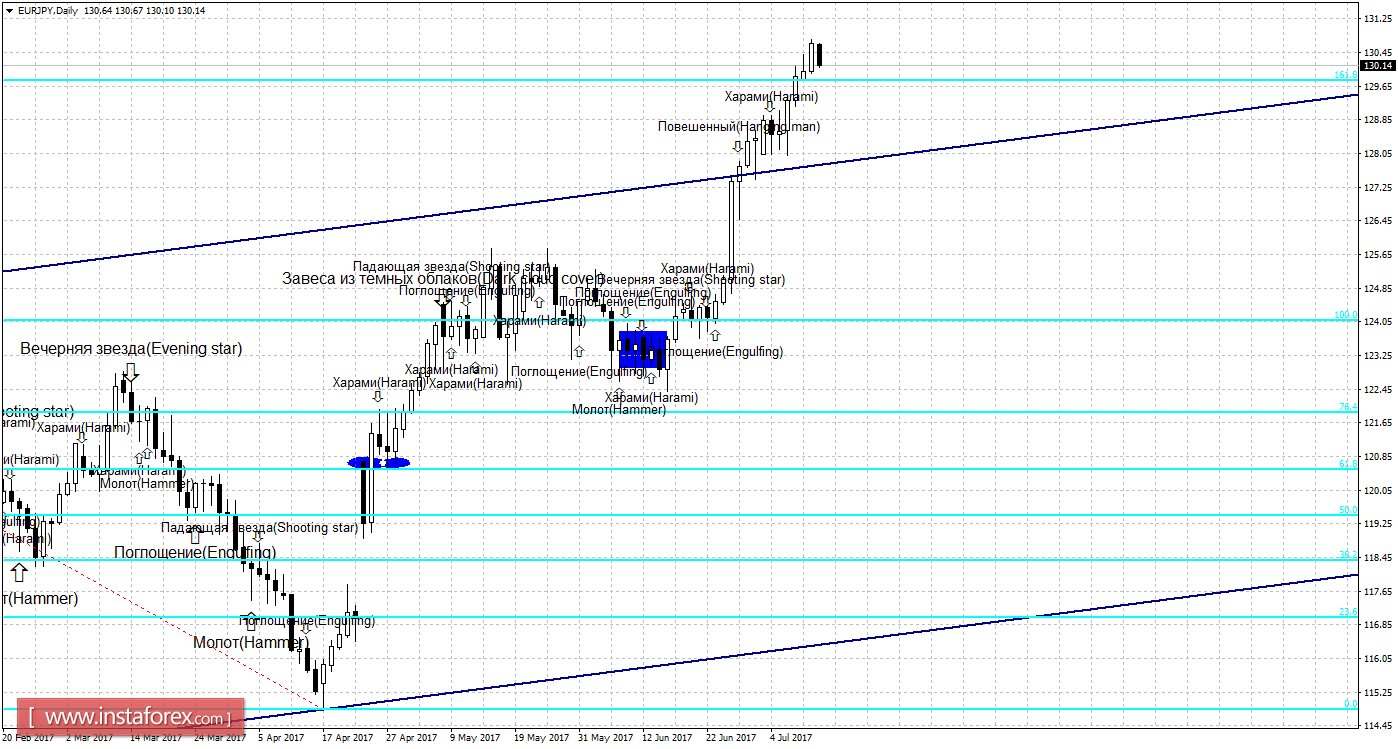
In the 24-hour chart, the prices were fixed above the correction level of 161.8% - 129.78, which eventually allows to resume the growth towards the next Fibo level of 200.0% - 133.33.
The Fibonacci grid is placed on the extremes from December 15, 2016 and April 17, 2017.
Specification:
Weak candle formations will be marked by plain text with a smaller size of the arrows.
Strong candle formations will be marked by bold text with a larger size of arrows.