 English
  Русский
 Bahasa Indonesia
 Bahasa Malay
 ไทย
ไทย Español
 Deutsch
 Български
 Français
 Tiếng Việt
 中文
中文 বাংলা
বাংলা हिन्दी
 Čeština
 Українська
 Română

4h
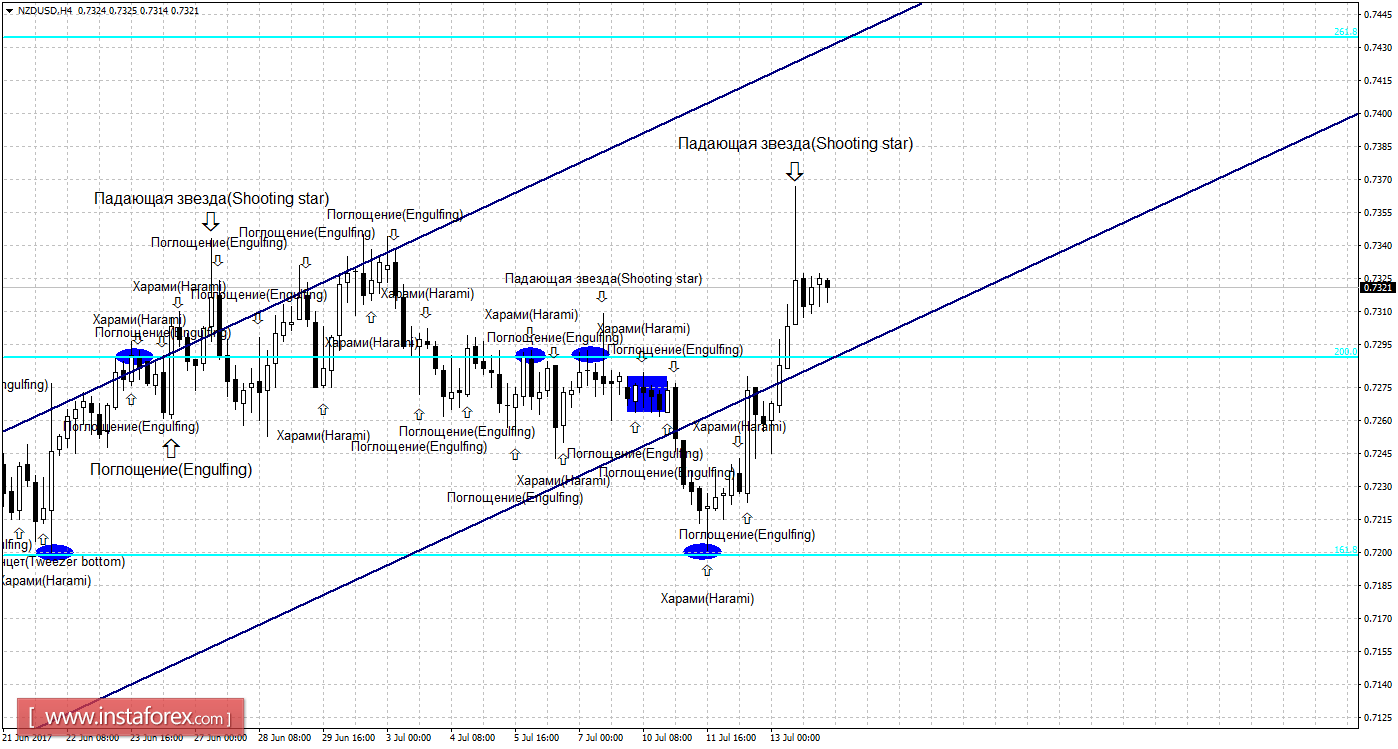
Quotations of the pair NZD / USD continued the growth process and fixed over the correction level of 200.0% - 0.7289. However, the bear formation "Falling Star" allows traders to expect a turn in favor of the US currency and a return to the Fibo level of 200.0%. The new bullish formation on July 14 will allow us to count on the resumption of the growth of quotations in the direction of the correction level of 261.8% to 0.7435. The consolidation of the pair's rate below the Fibo level of 200.0% will work in favor of a further drop in quotations in the direction of the correction level of 161.8% - 0.7199.
The Fibo grid is built on extremes from April 24, 2017 and May 11.
Daily
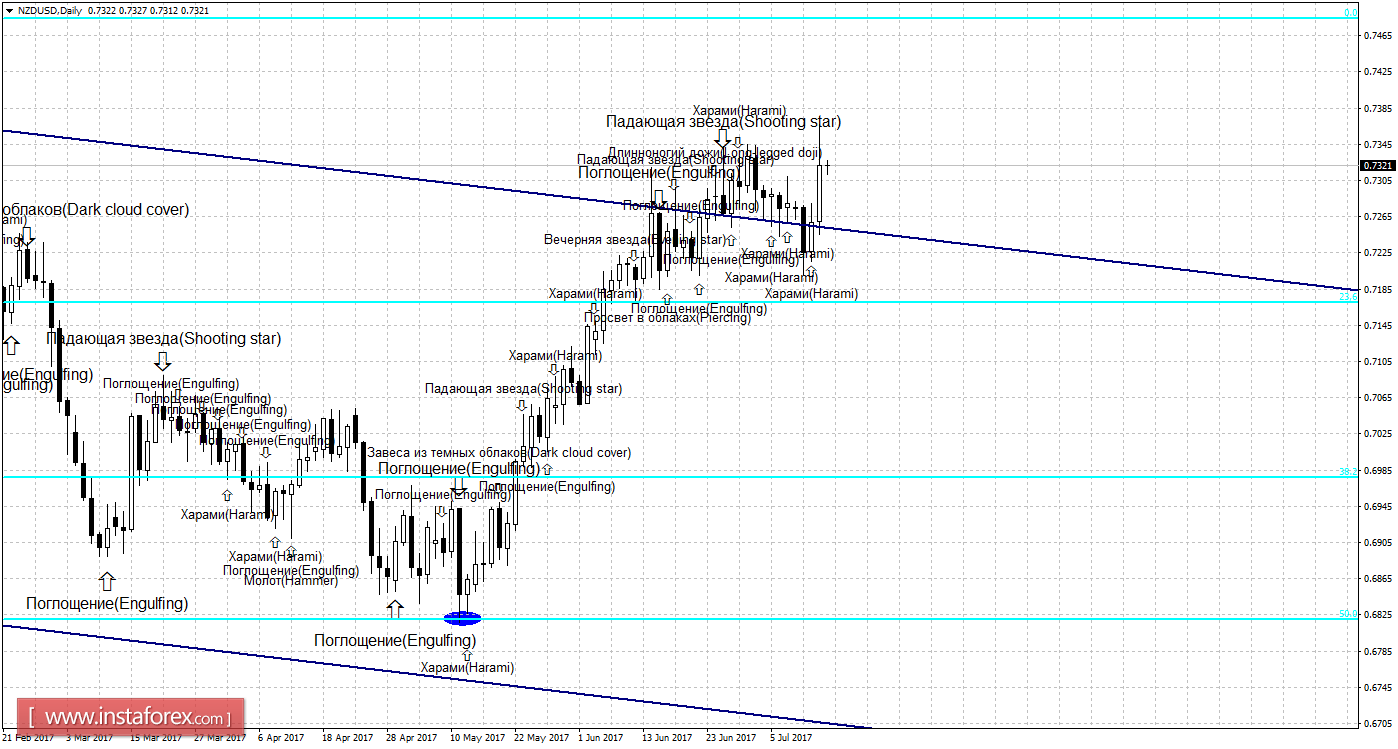
On the 24-hour chart, after the bovine candlestick formation "Kharami", the quotes executed a turn in favor of the currency of New Zealand and resumed growth in the direction of the correction level of 0.0% -0.7483. The bearish formation will allow traders to expect a reversal in favor of the US dollar and the resumption of the decline in the direction of the correction level of 23.6% - 0.7172. The consolidation of the pair's rate below the Fibo level of 23.6% will increase the likelihood of continuing the decline towards the corrective level of 38.2% - 0.6977.
The Fibo grid is built on extremes from August 24, 2015 and September 8, 2016.
Specification:
Weak candle formations will be marked by the usual text and the size of the arrows.
Strong candle formations will be marked by a more bold text and a larger size of arrows.