 English
  Русский
 Bahasa Indonesia
 Bahasa Malay
 ไทย
ไทย Español
 Deutsch
 Български
 Français
 Tiếng Việt
 中文
中文 বাংলা
বাংলা हिन्दी
 Čeština
 Українська
 Română

4h
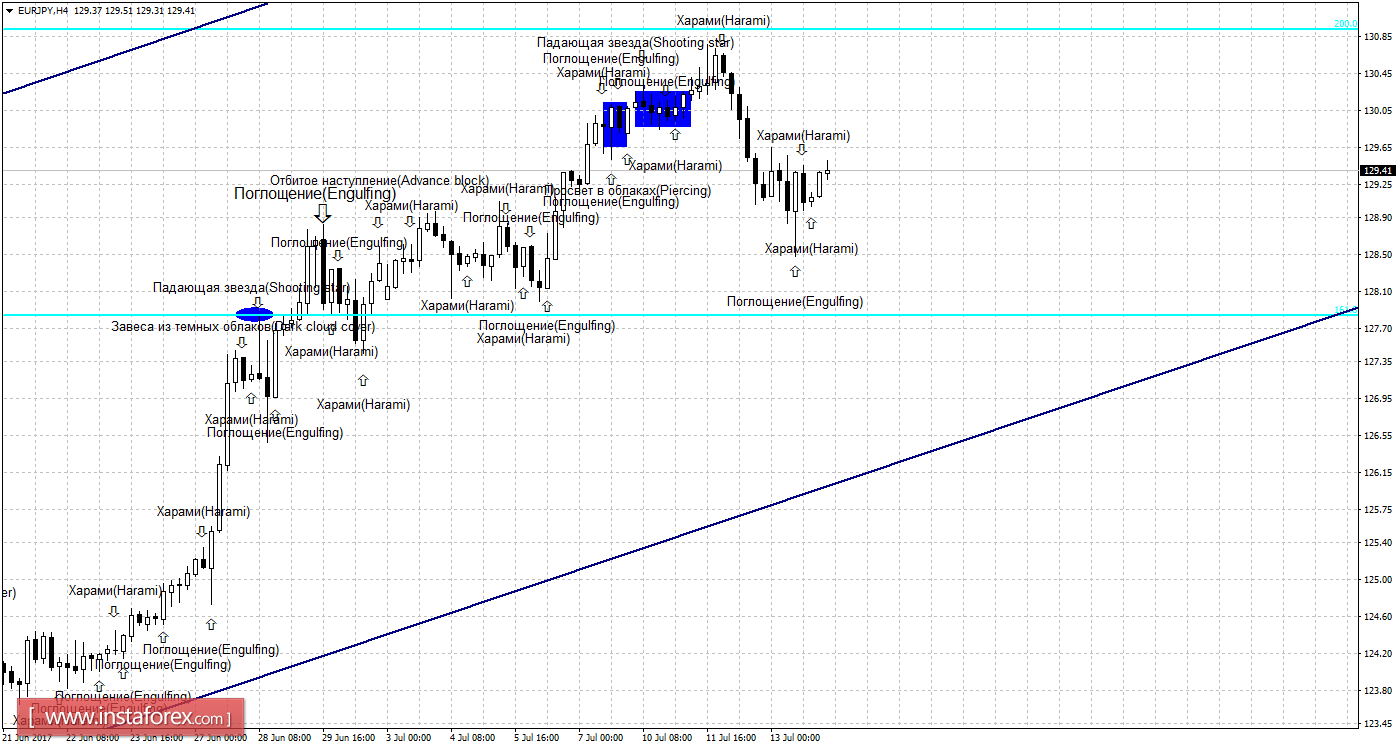
The bovine candle formation "Absorption" and the subsequent bullish formation "Harami" allowed the pair to turn in favor of the European currency and begin to increase in the direction of the Fibo level of 200.0% - 130.92. The bearish formation on July 14 will be interpreted as a correction signal, since the equidistance channel is "up" and will allow to count on a turn in favor of the Japanese currency and a slight drop toward the corrective level of 161.8% to 127.85. Strengthening the rate of the pair below the Fibo level of 161.8% will increase the chances of further falling quotations.
The Fibo grid is built on extremes from March 13, 2017 and April 17, 2017.
Daily
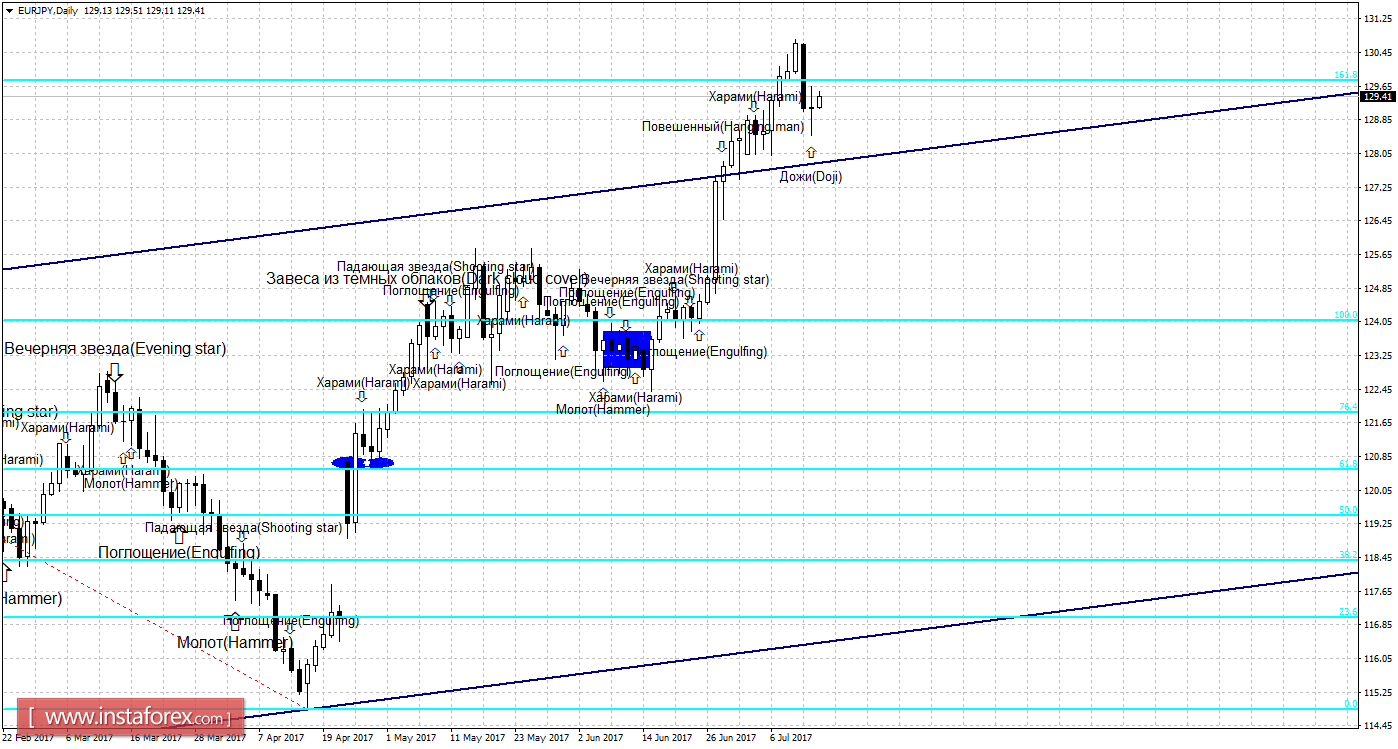
On the 24-hour chart, the pair executed a reversal in favor of the Japanese currency and consolidation under the correction level of 161.8% - 129.77. As a result, the drop in quotations can be continued in the direction of the next Fibo level of 100.0% - 124.07. The bovine candle formation "Doji" allows the pair to turn in favor of the euro and resume growth. Passing a pair of its low or a bear formation will work in favor of the continued drop in quotations. Fixing a pair above the Fibo level of 161.8% will increase the likelihood of continued growth.
The Fibo grid is built on extremes from December 15, 2016 and April 17, 2017.
Specification:
Weak candle formations will be marked by the usual text and the size of the arrows.
Strong candle formations will be marked by a more bold text and a larger size of arrows.