English
  Русский
 Bahasa Indonesia
 Bahasa Malay
 ไทย
ไทย Español
 Deutsch
 Български
 Français
 Tiếng Việt
 中文
中文 বাংলা
বাংলা हिन्दी
 Čeština
 Українська
 Română

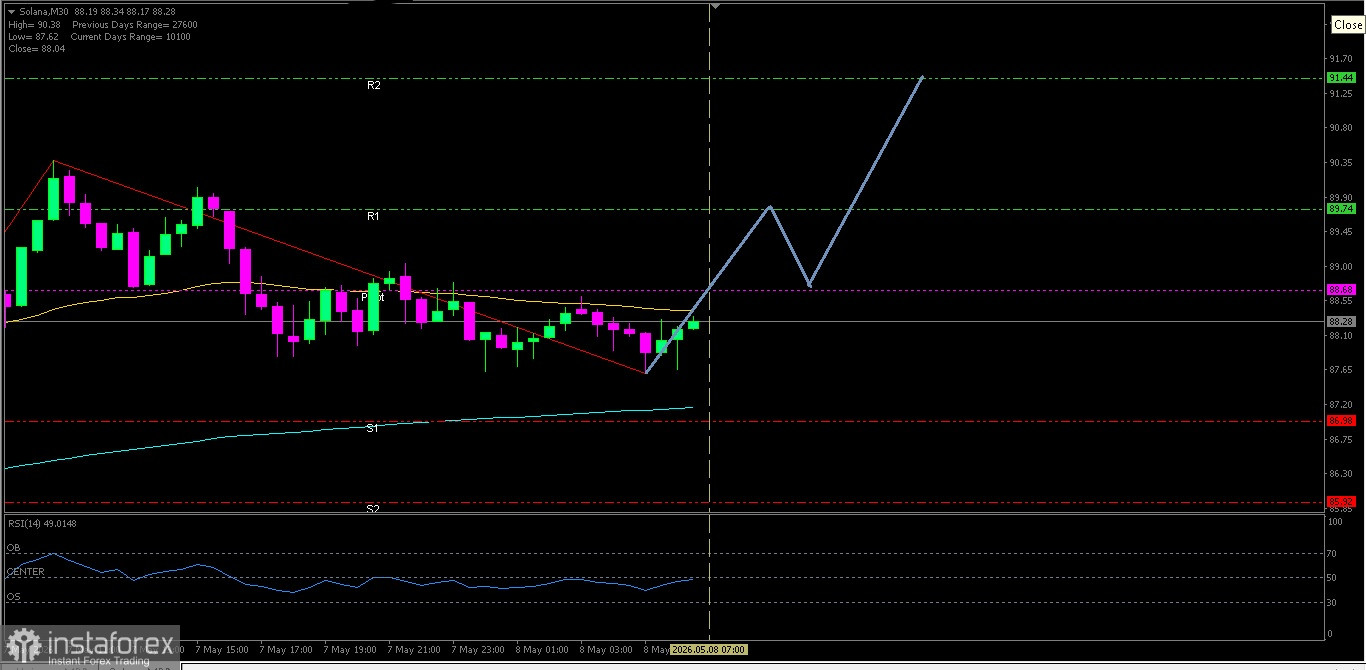
SOLANA
The Solana cryptocurrency is currently has a bullish bias, which is confirmed by a Golden Cross intersection between both of its EMAs.
Key Levels
1. Resistance. 2 : 91.44
2. Resistance. 1 : 89.74
3. Pivot : 88.68
4. Support. 1 : 86.98
5. Support. 2 : 85.92
Tactical Scenario
Positive Reaction Zone: If the price breaks out above 88.68, it may move up toward 89.74.
Momentum Extension Bias: If 89.74 is also successfully broken out, there is potential for strengthening to continue to the 91.44 level.
Invalidation Level / Bias Revision
The upside bias weakens if Solana falls and breaks below 85.92.
Technical Summary
EMA(50) : 88.42
EMA(200): 87.14
RSI(14) : 46.95
Economic News Release Agenda:
From the United States the following economic data will be released:
US - Average Hourly Earnings m/m - 19:30 WIB
US - Non-Farm Employment Change - 19:30 WIB
US - Unemployment Rate - 19:30 WIB
US - Prelim UoM Consumer Sentiment - 21:00 WIB
US - Prelim UoM Inflation Expectations - 21:00 WIB
US - Final Wholesale Inventories m/m - 21:00 WIB