 English
  Русский
 Bahasa Indonesia
 Bahasa Malay
 ไทย
ไทย Español
 Deutsch
 Български
 Français
 Tiếng Việt
 中文
中文 বাংলা
বাংলা हिन्दी
 Čeština
 Українська
 Română

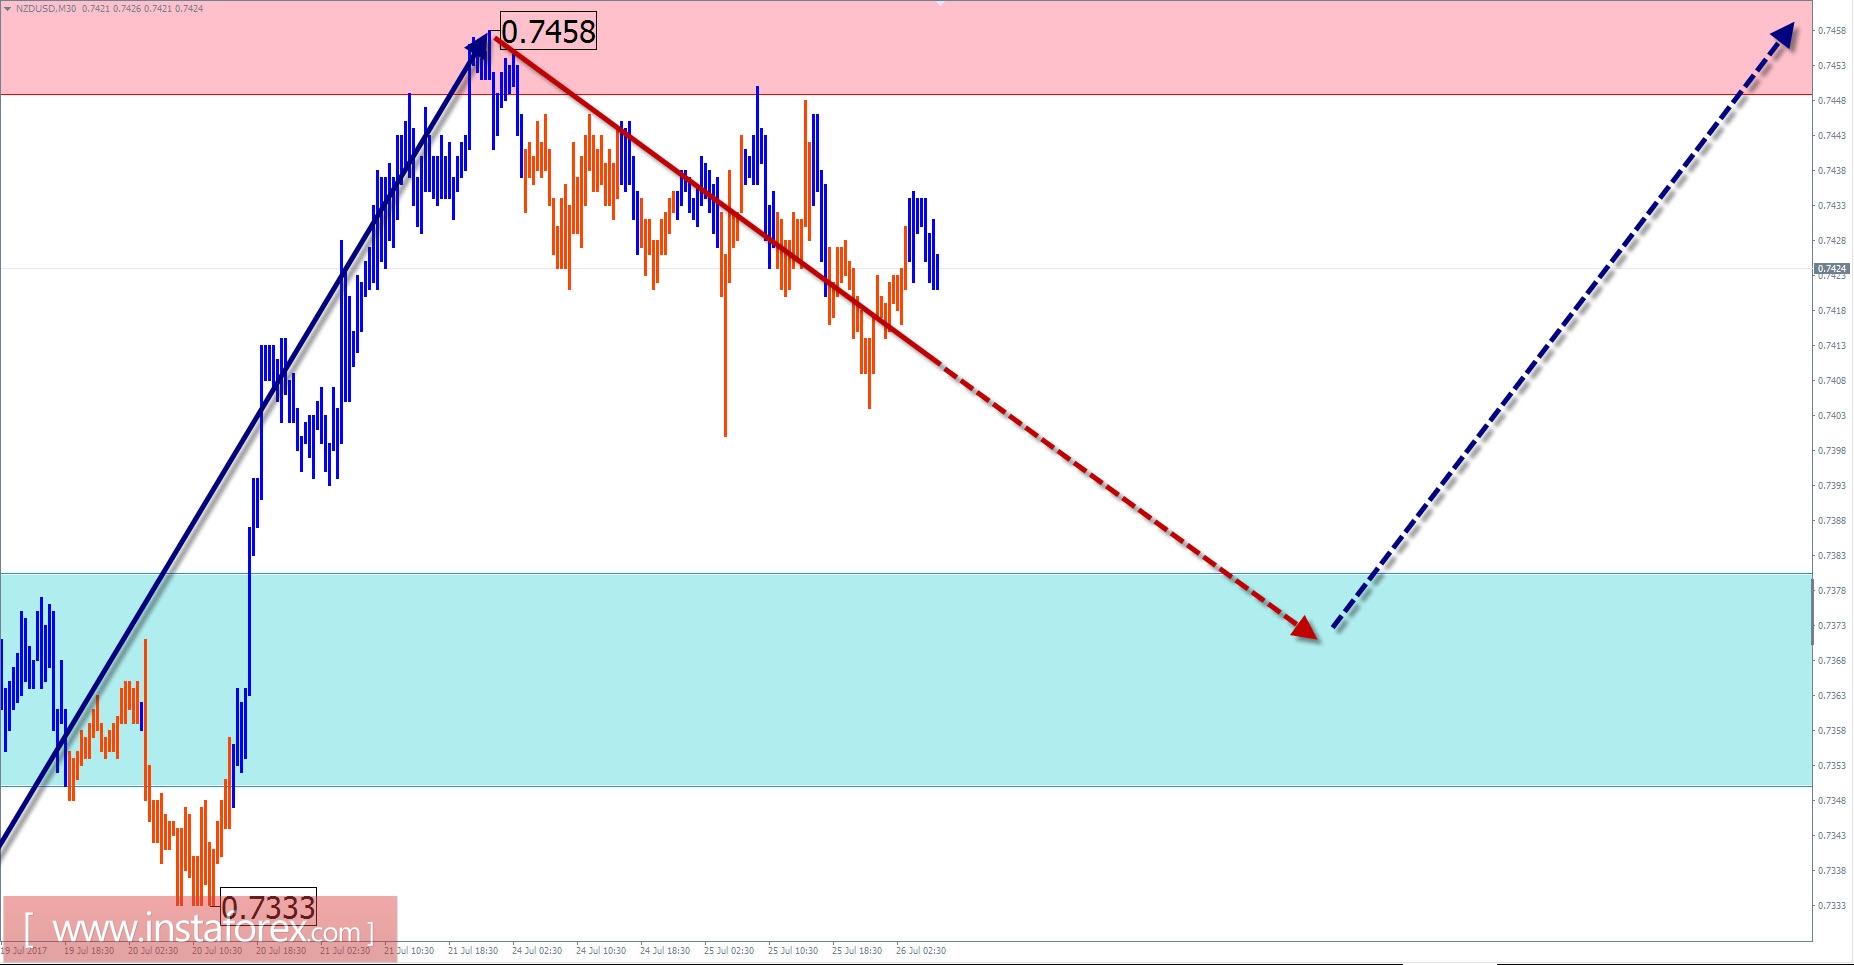
Overview of the currency pair NZD / USD with the current day forecast
The direction of the New Zealand dollar in the short-term trend is set by a bullish wave from August 2015. The wave in the larger formation takes the place of correction and is close to completion. The final wave section (C) has started since May 11.
To date, the quotes of the pair prop up the lower boundary of the calculated zone of a potential reversal. The chance of completing the entire wave on this section of the graph increases significantly.
The contact price zone at the end of last week triggered a response. Today, it is likely that the course will continue downward until the end is complete. A reduction is expected to the boundaries of the estimated support zone. Then, a second attempt will be made to increase the pair's price. With a high probability, the ascending phase of the movement of the pair will move in time on the next trading day.
Boundaries of the resistance zone:
- 0.7450 / 80
Boundaries of the support zone:
- 0.7380 / 50
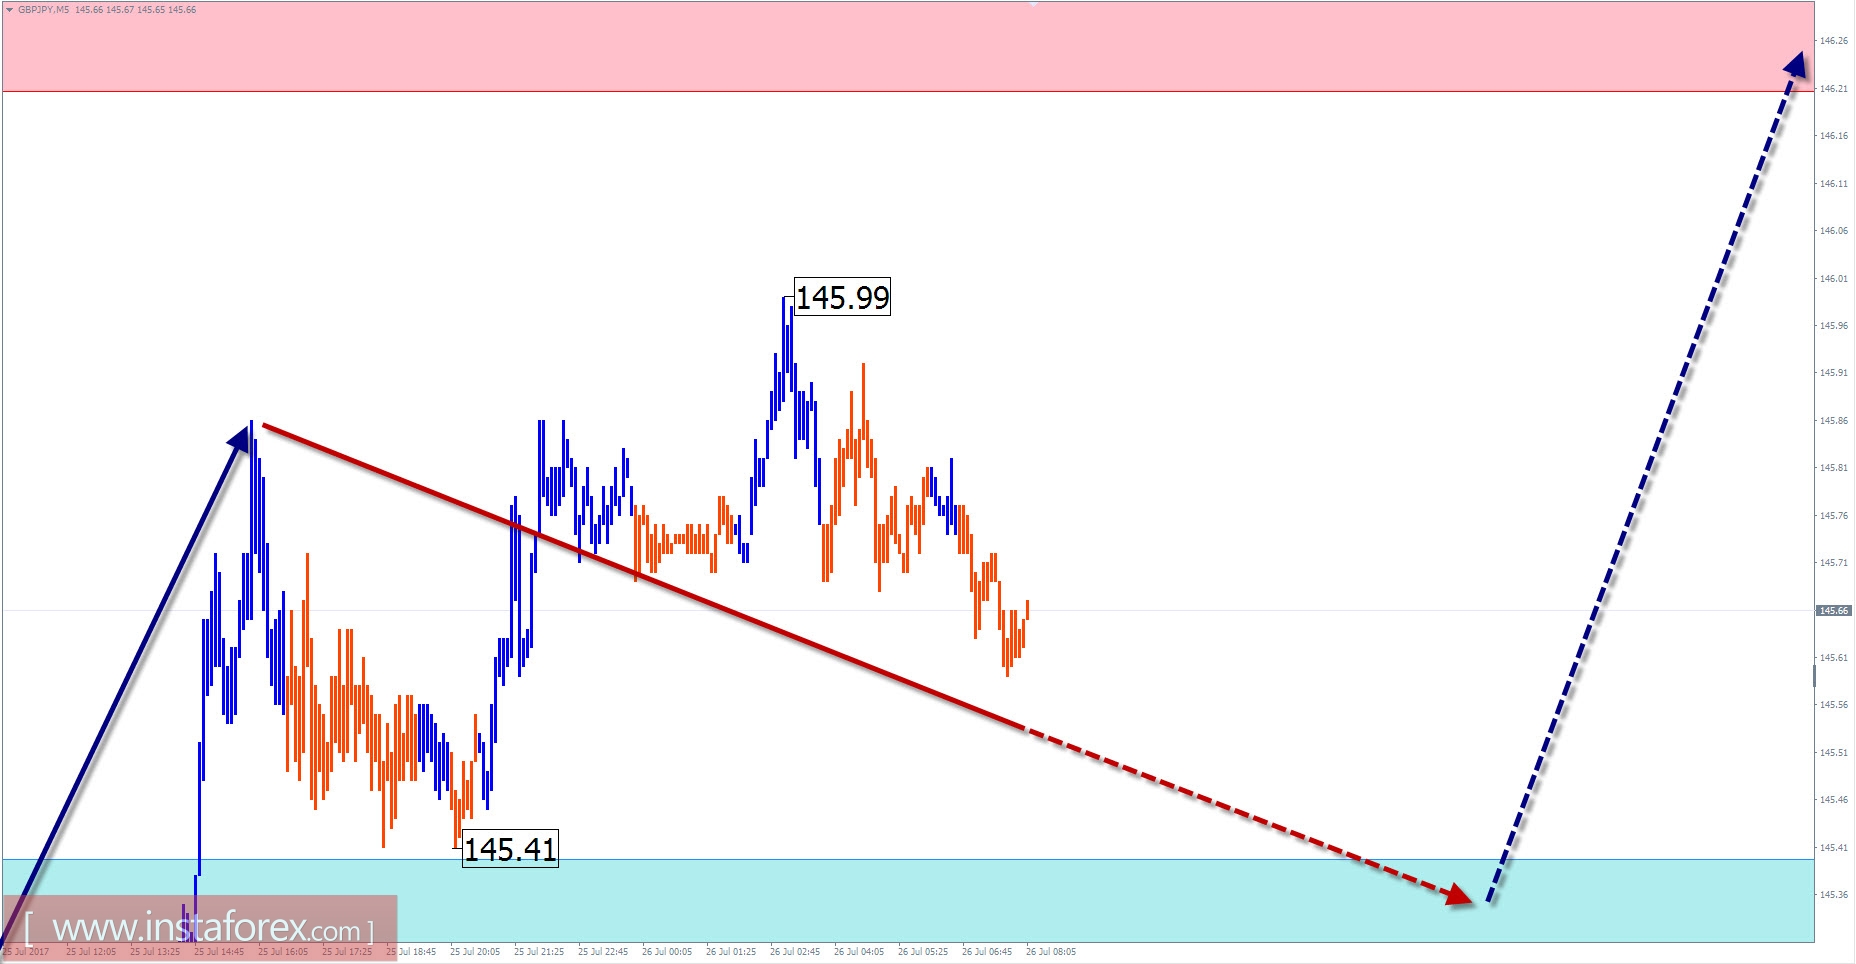
Overview of the currency pair GBP / JPY with the current day forecast
Since July last year, the direction of price fluctuations of the pound / yen is set by the algorithm of the rising wave. It has pronounced a corrective character. Extremes have formed a distinct figure "ascending triangle" on the chart of the pair and judging by the narrowing of the range between the boundaries of the converging channel, the breakthrough of the boundaries of the flat zone is not "far off". The preliminary calculation of the target zone indicates a high probability of upward growth, at least 5 price figures from current price values.
The unfinished wave model for today was the bullish design of June 12. After the completion of the correction from July 21, it forms a reversal zigzag.
Today, the overall lateral mood of cross traffic is expected. In the first half of the day, a weak downward trend is expected. Towards the end of the day, within the framework of support, the probability of a change in the rate and the beginning of a price rise will increase. The range of the daily course of the pair limits the zone of resistance.
Boundaries of the resistance zone:
- 146.20 / 50
Boundaries of the support zone:
- 145.40 / 10
Explanations to the figures: For simplified wave analysis, a simple type of wave is used that combines 3 parts (A; B; C). Of such waves, all kinds of correction are composed and most of the impulses. On each considered time-frame the last, incomplete wave is analyzed.
The zones marked on the graphs are indicated by the calculation areas in which the probability of a change in the direction of motion is significantly increased. The arrows indicate the wave counting according to the technique used by the author. The solid background of the arrows indicates the structure formed, the dotted one indicates the expected wave motion.
Note: The wave algorithm does not take into account the duration of the tool movements in time. The forecast is not a trading signal! To conduct a transaction, you need to confirm the signals used by your trading systems.