English
  Русский
 Bahasa Indonesia
 Bahasa Malay
 ไทย
ไทย Español
 Deutsch
 Български
 Français
 Tiếng Việt
 中文
中文 বাংলা
বাংলা हिन्दी
 Čeština
 Українська
 Română

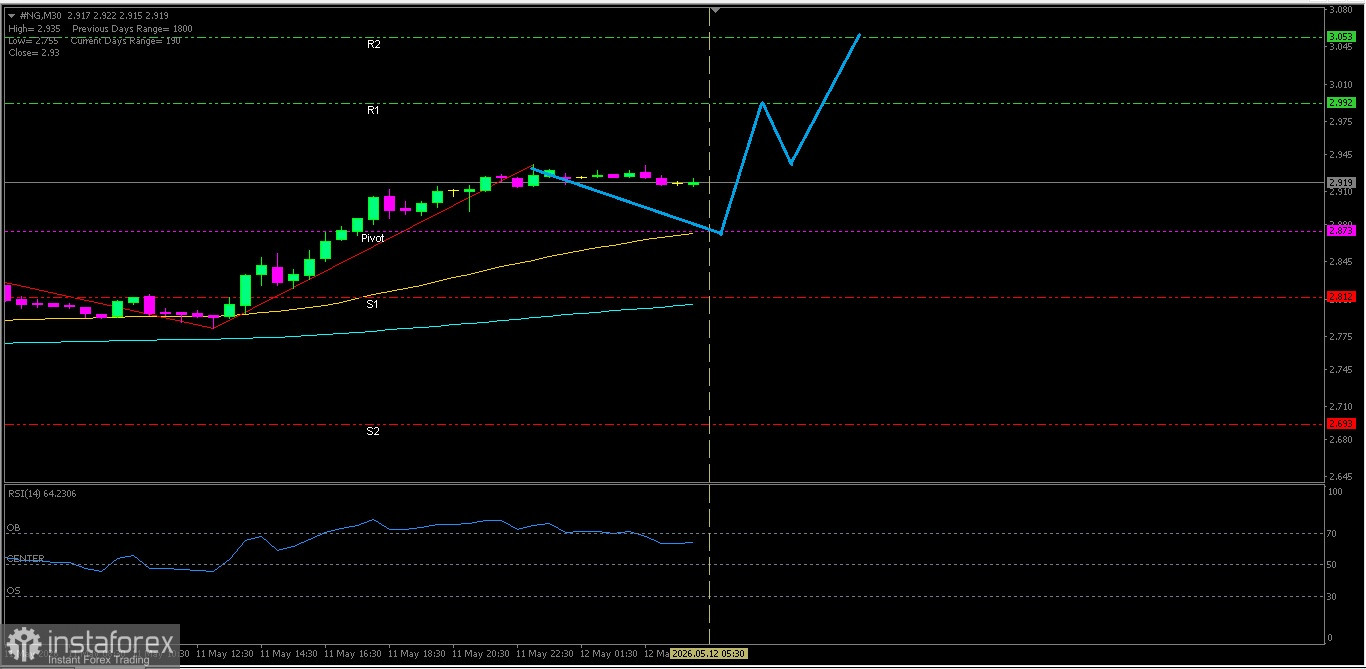
NATURAL GAS
With RSI(14) indicator position in the Neutral-Bullish area and both EMAs which forming a Golden Cross, then there is potential for #NG to test its nearest resistance level.
Key Levels
1. Resistance. 2 : 3.053
2. Resistance. 1 : 2.992
3. Pivot : 2.873
4. Support. 1 : 2.812
5. Support. 2 : 2.693
Tactical Scenario
Positive Reaction Zone: If #NG holds and does not break below 2.873, Natural Gas may move up toward 2.992.
Momentum Extension Bias: If 2.992 is broken out to the upside, there is potential to test 3.053.
Invalidation Level / Bias Revision
The upside bias weakens if price falls below 2.693.
Technical Summary
EMA(50) : 2.871
EMA(200): 2.805
RSI(14) : 64.23
Economic News Release Agenda:
Today the United States will release the following economic data:
US - NFIB Small Business Index - 17:00 WIB
US - ADP Weekly Employment Change - 19:15 WIB
US - Core CPI m/m - 19:30 WIB
US - CPI m/m - 19:30 WIB
US - CPI y/y - 19:30 WIB
US - 10-y Bond Auction - 00:01 WIB
US - Federal Budget Balance - 01:00 WIB
US - API Weekly Statistical Bulletin - 03:30 WIB