 English
  Русский
 Bahasa Indonesia
 Bahasa Malay
 ไทย
ไทย Español
 Deutsch
 Български
 Français
 Tiếng Việt
 中文
中文 বাংলা
বাংলা हिन्दी
 Čeština
 Українська
 Română

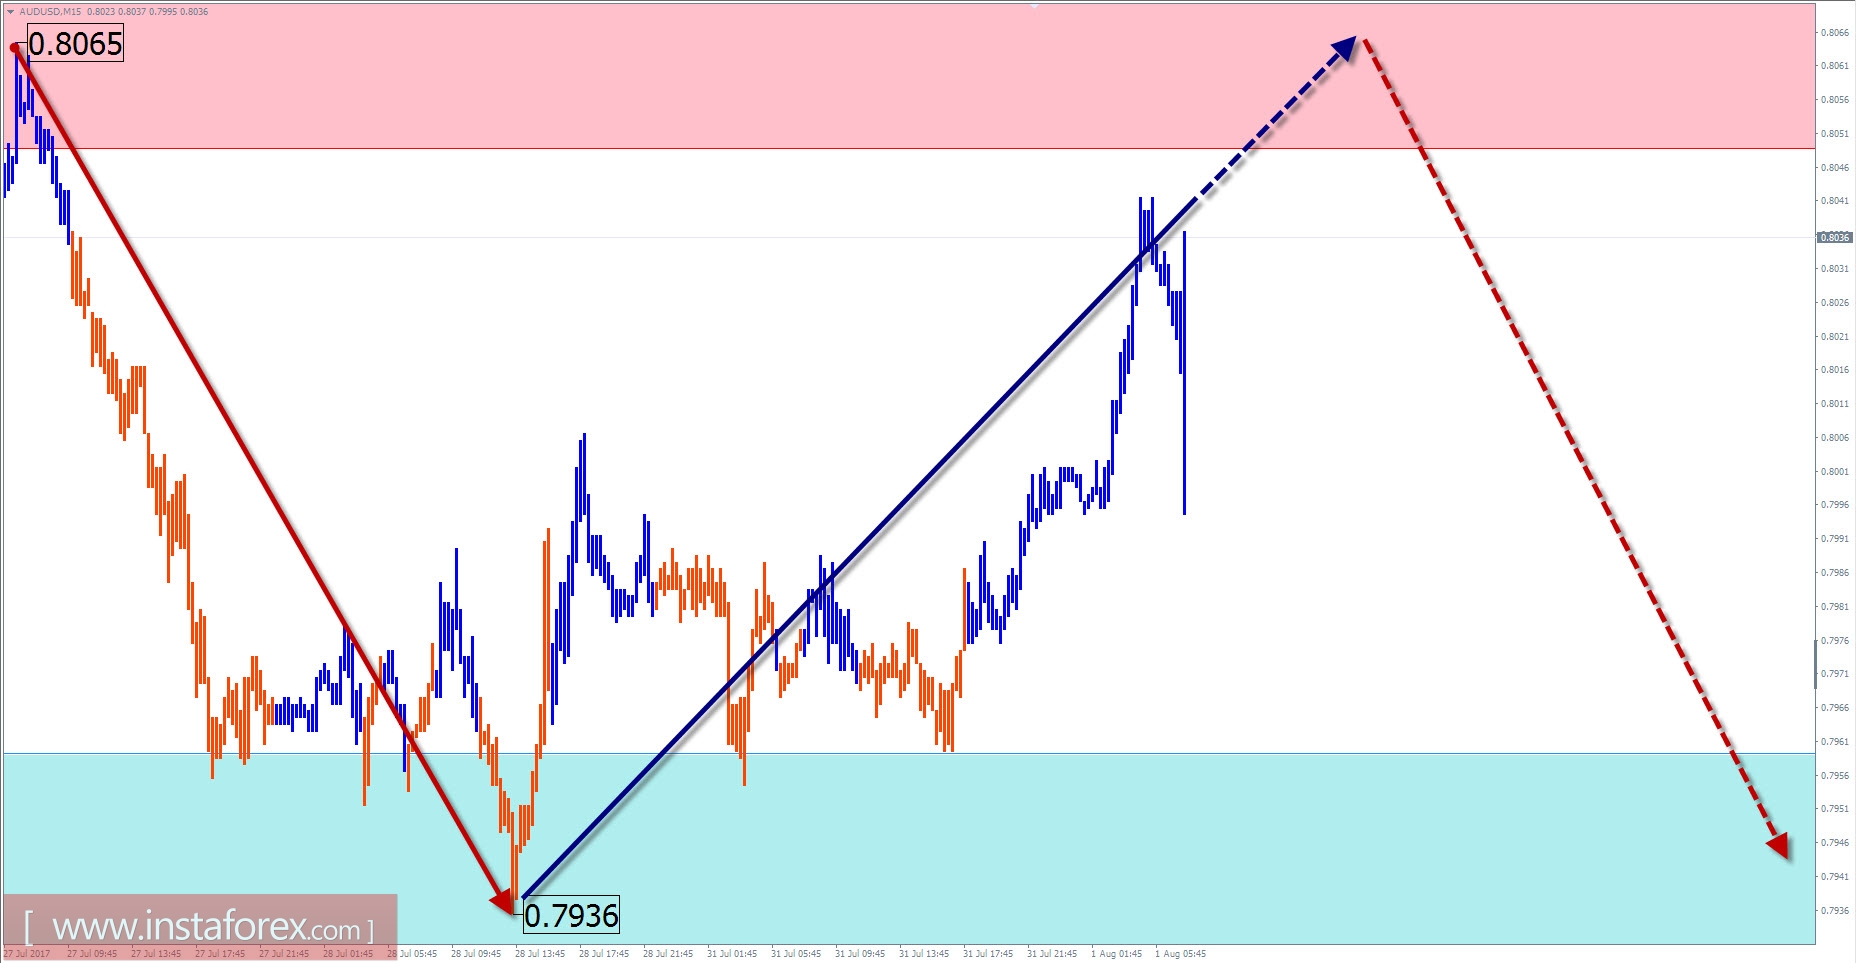
AUD / USD overview with today's forecast
On a large scale, a lateral correction continues to form in the major pair Australian dollar chart. The direction of the short-term trend at the end was set by a bull wave from the end of December last year. There is a clear zigzag seen in its structure.The final part started on May 9 has not been completed so far. A preliminary calculation of the target allows you to assume the price to move upward for at least 4 price figures. The final part that started on May 9 has not been completed so far. The preliminary calculation of the target allows you to assume the price to move upward for at least 4 price figures.
The chart has outlined another corrective wave since July 18, which is developed into a complex figure with an "expanding triangle".Today, there is a high probability for a change in the main direction of the price and the beginning of a decline.
Boundaries of resistance zones:
- 0.8050 / 80
Support zone boundaries:
- 0.7960 / 30
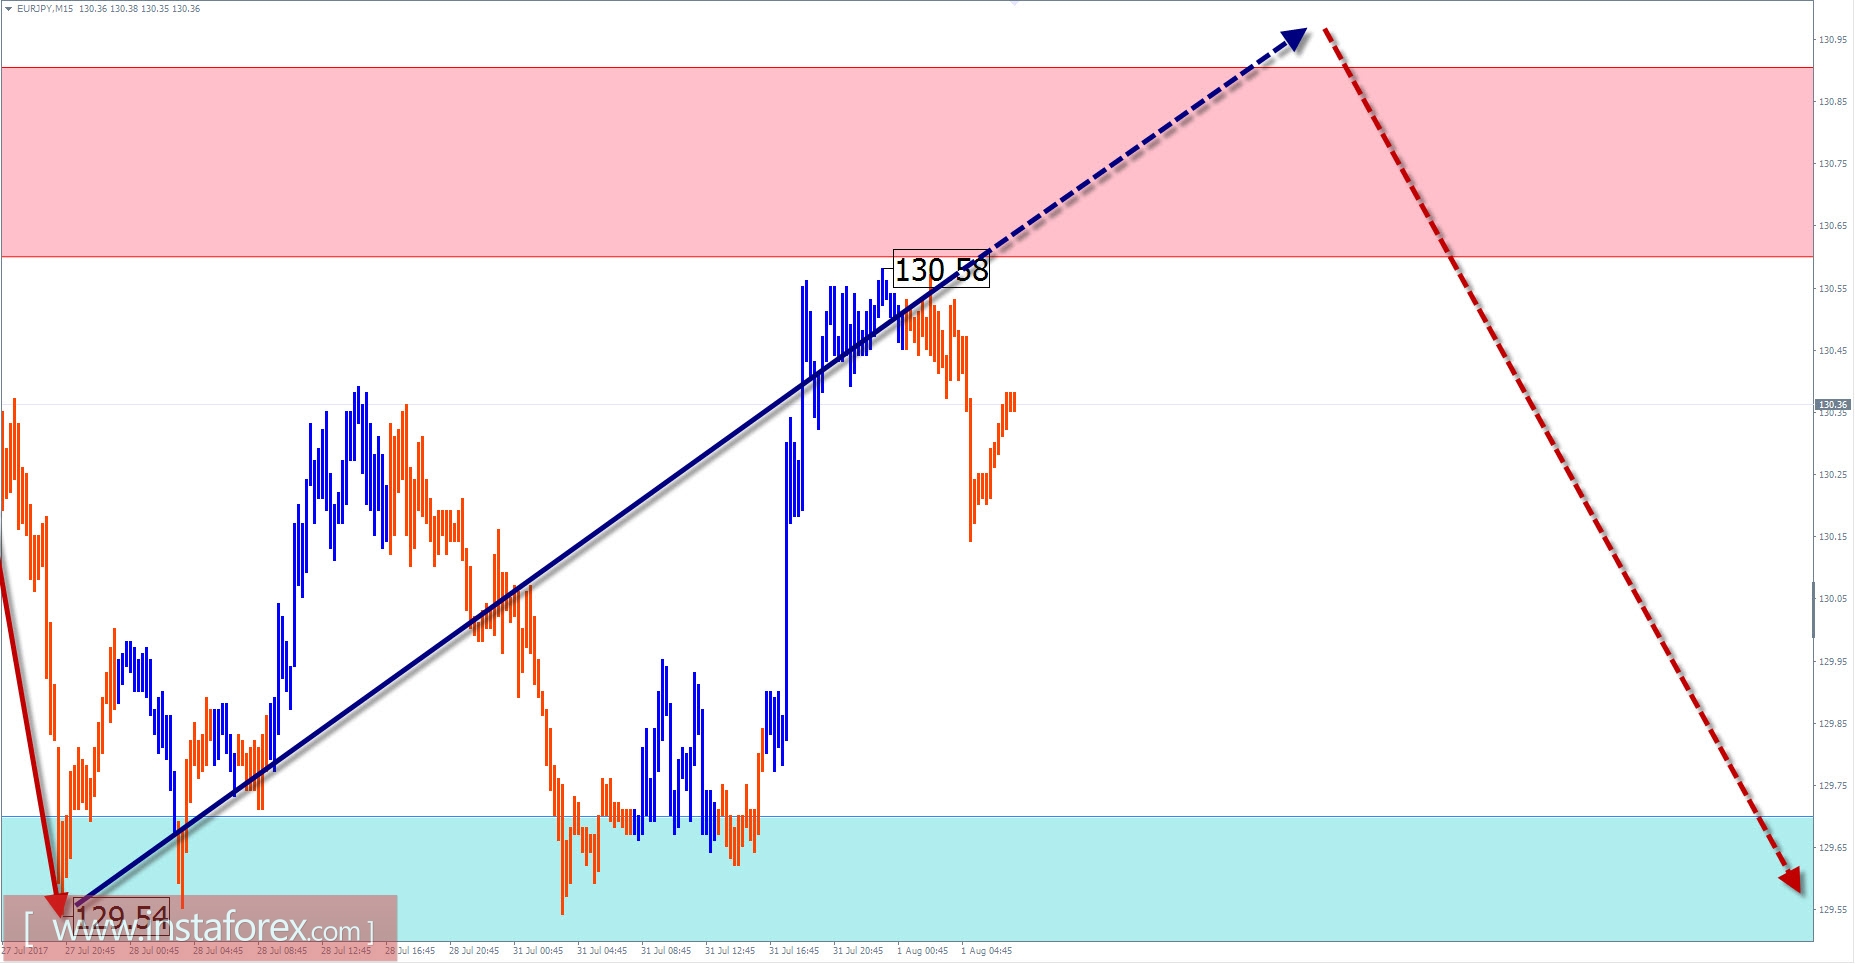
EUR / JPY outlook with today's forecast
As a result of a bullish wave formation on a larger scale, the quotes of the euro / yen cross currency pair reached the upper edge of the strong reversal zone.
Today's morning, the pressure on the resistance zone is possible. A short break in its upper limit can not be ruled out. Toward the end of the day, the probability of a change in the exchange rate and the beginning of the pair's turn will increase. The support zone shows the probable area for completing the day's turn of the pair.
Boundaries of resistance zones:
- 130.60 / 90
Support zone boundaries:
- 129.70 / 40
Explanations to the figures:
For simplified wave analysis, a simple waveform is used that combines 3 parts namely A, B, and C. All kinds of correction are created and most of the impulses can be found in these waves.
The zones marked on the graphs indicate the probability of a change in the direction of motion has significantly increased as calculated in the areas. Arrows indicate the wave counting following the technique used by the author. A solid background of the arrows signifies the structure has been formed while the dotted one means the expected wave motion.
Attention: The wave algorithm does not take into account the duration of the tool movements in time.