 English
  Русский
 Bahasa Indonesia
 Bahasa Malay
 ไทย
ไทย Español
 Deutsch
 Български
 Français
 Tiếng Việt
 中文
中文 বাংলা
বাংলা हिन्दी
 Čeština
 Українська
 Română

Since October last year, the daily scale of the pound sterling chart shows an upward wave. In a larger wave model, it takes the place of correction. Analysis of the wave structure shows its completeness. By now, the price is in the region of the lower boundary of a potential reversal zone, strengthened by a large scale. All together indicates a high probability of an early completion of the main wave. With an option of an extension of the current trend, the price is waiting for a corrective decline.
Today, the main direction of the price movement of the pair remains the upward trend. In the morning, there may be a short-term decline to the support boundaries. Activation of the main trend is more likely at the end of the day.
Boundaries of the resistance zone:
- 1.3270 / 1.3300
Boundaries of the support zone:
- 1.3190 / 60
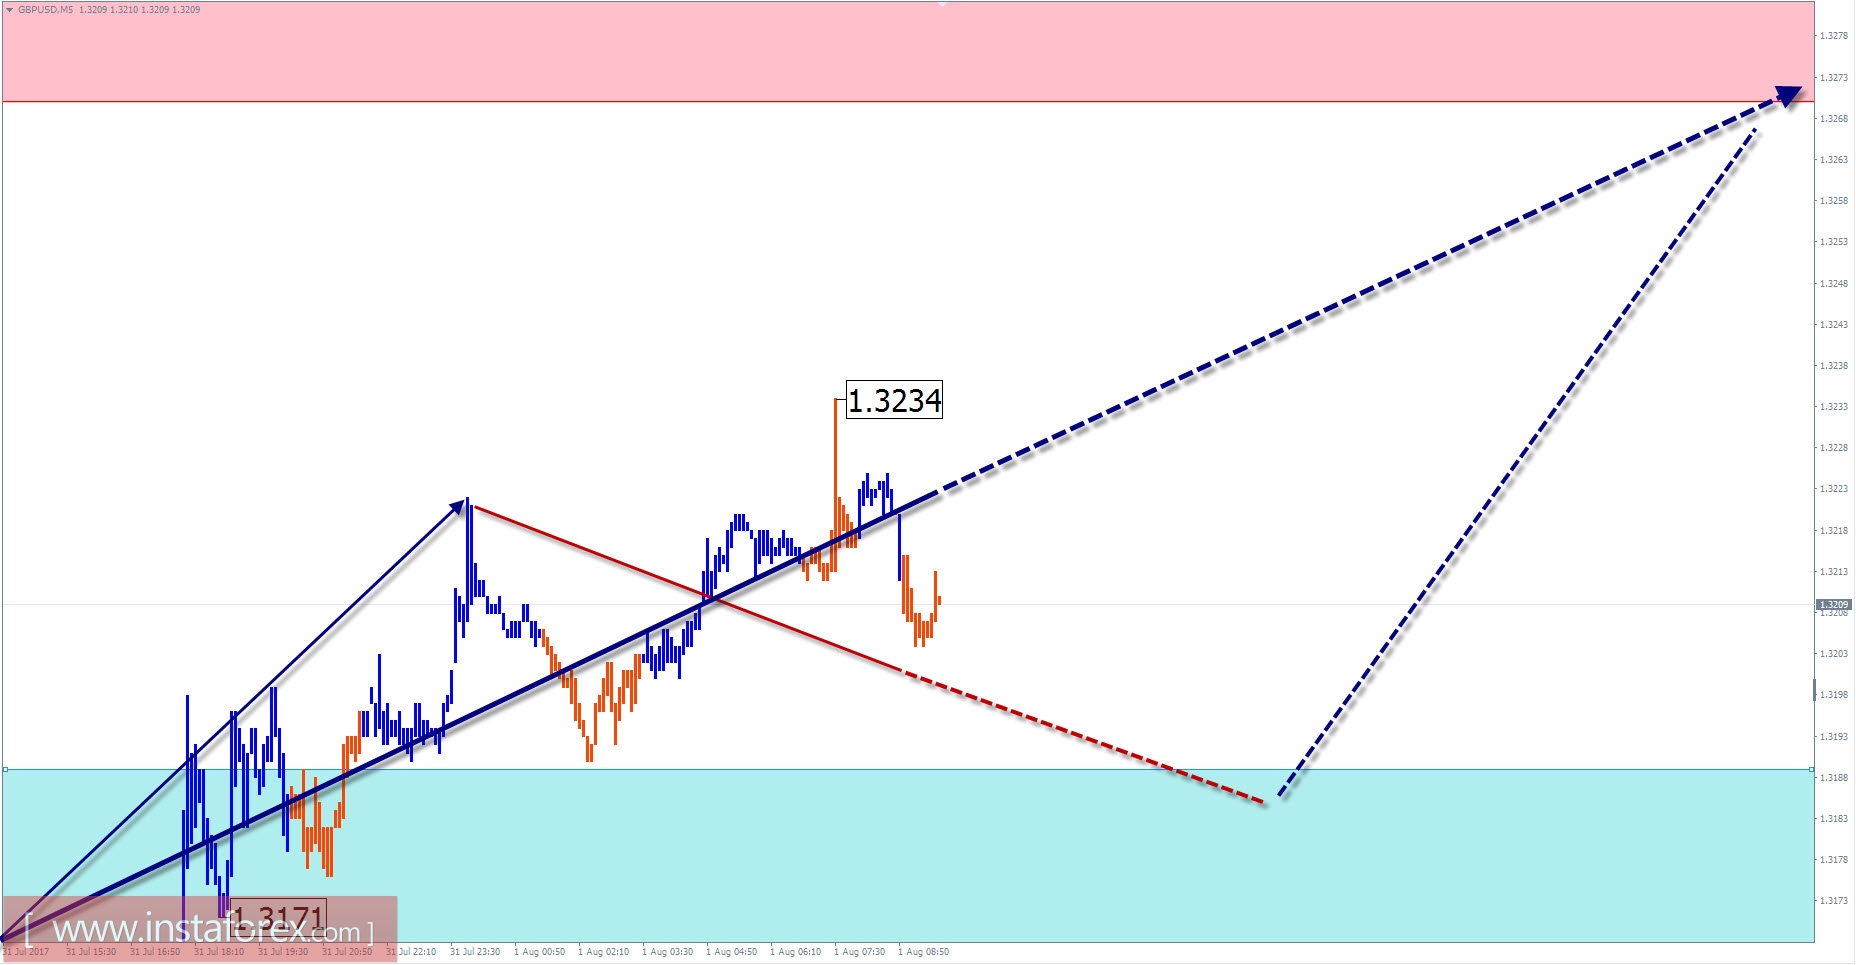
Explanations to the figures: For simplified wave analysis, a simple type of wave is used that combines 3 parts (A; B; C). Of such waves, all kinds of correction are composed and most of the impulses. On each considered time-frame the last, incomplete wave is analyzed.
The zones marked on the graphs are indicated by the calculation areas in which the probability of a change in the direction of motion is significantly increased. Arrows indicate the wave counting according to the technique used by the author. The solid background of the arrows indicates the structure formed, the dotted one indicates the expected wave motion.
Note: The wave algorithm does not take into account the duration of the tool movements in time. The forecast is not a trading signal! To conduct a transaction, you need to confirm the signals used by your trading systems.