 English
  Русский
 Bahasa Indonesia
 Bahasa Malay
 ไทย
ไทย Español
 Deutsch
 Български
 Français
 Tiếng Việt
 中文
中文 বাংলা
বাংলা हिन्दी
 Čeština
 Українська
 Română

Since the beginning of last year, a bearish wave continues on the daily chart of the Canadian dollar. It forms a zigzag, correcting the previous long ascending trend section. The quotations of the pair have already updated the local minimum of May last year. Since the middle of last month, the pair's price is in a wide reversal zone. On this section of the chart is a great chance of changing the short-term direction of traffic. If the current correction does not end here, the counter wave model should be large enough to form a rollback.
At the end of the current trend wave, a hidden correction was completed. The last 3 days formed a new descending zigzag. After the completion of the bull's rollback, a new jerk will follow in the main direction.
Today, in the first half of the day, within the zone of resistance, a common flute movement is expected. A short-term reduction in the support zone is not excluded. The rising phase of the movement is more likely at the end of the day.
Boundaries of the resistance zone:
- 1.2550 / 80
Boundaries of the support zone:
- 1.2450 / 20
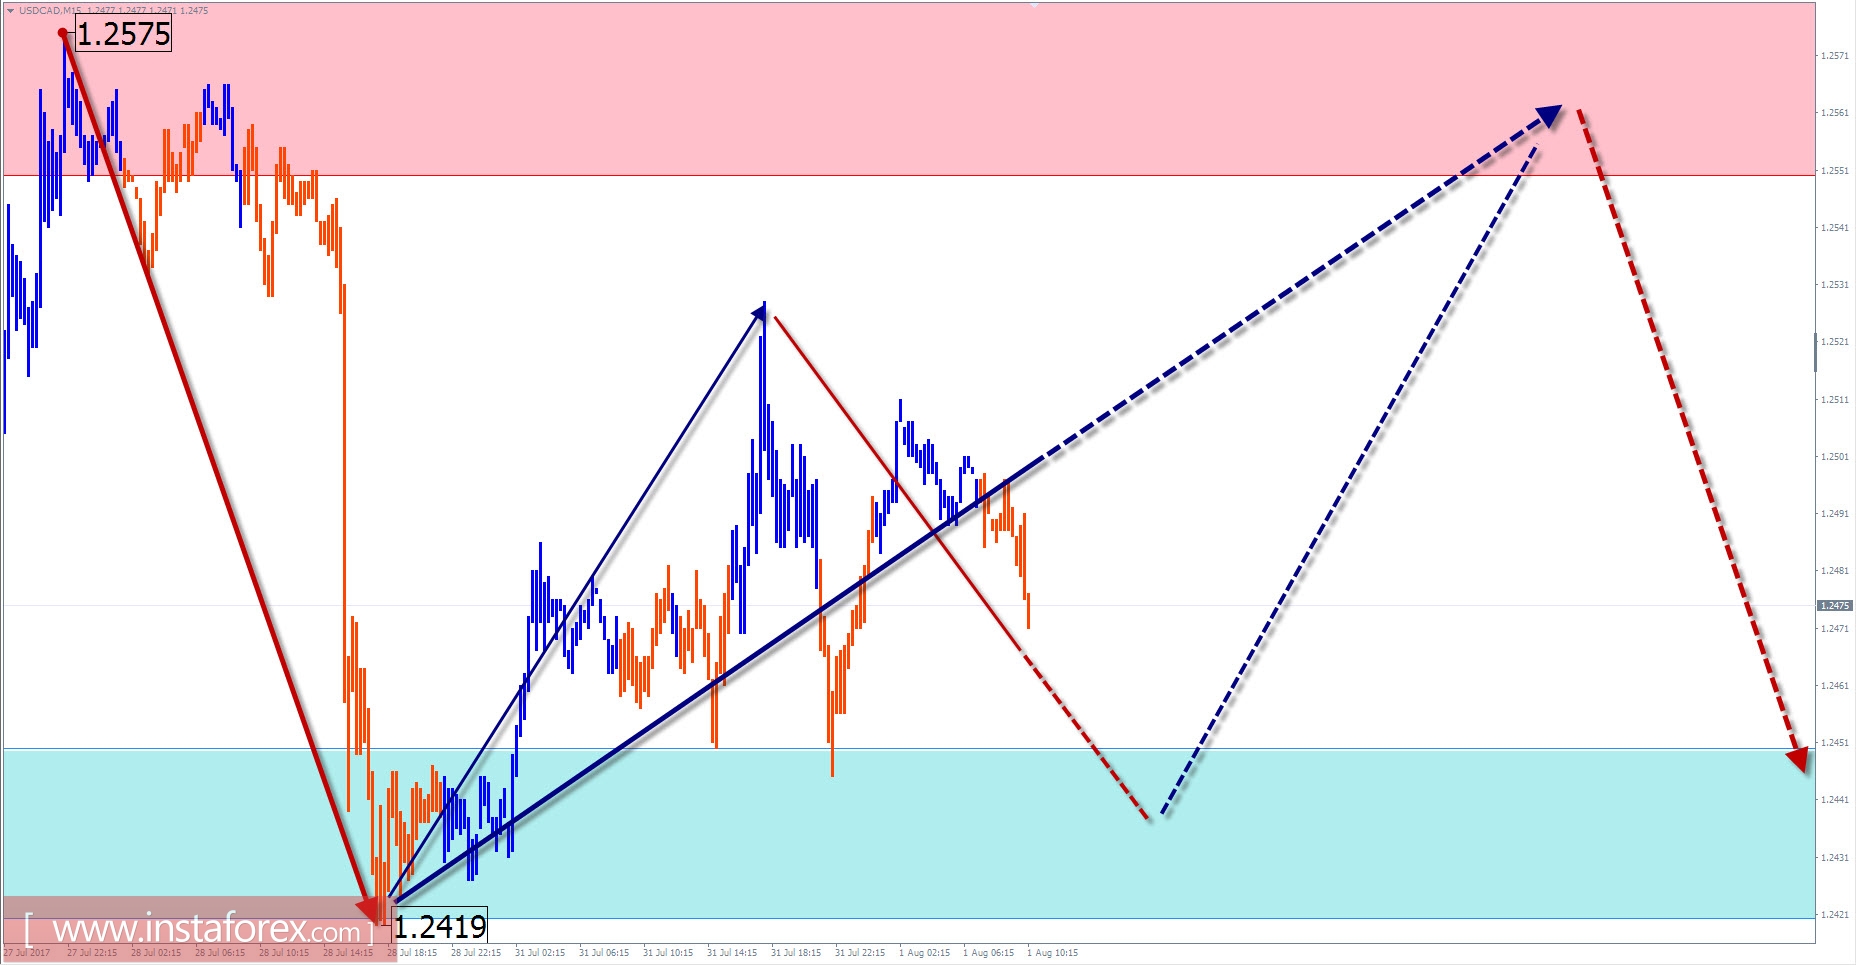
Explanations to the figures: For simplified wave analysis, a simple type of wave is used that combines 3 parts (A; B; C). Of such waves, all kinds of correction are composed and most of the impulses. On each considered time-frame the last, incomplete wave is analyzed.
The zones marked on the graphs are indicated by the calculation areas in which the probability of a change in the direction of motion is significantly increased. Arrows indicate the wave counting according to the technique used by the author. The solid background of the arrows indicates the structure formed, the dotted one indicates the expected wave motion.
Note: The wave algorithm does not take into account the duration of the tool movements in time. The forecast is not a trading signal! To conduct a transaction, you need to confirm the signals used by your trading systems.