 English
  Русский
 Bahasa Indonesia
 Bahasa Malay
 ไทย
ไทย Español
 Deutsch
 Български
 Français
 Tiếng Việt
 中文
中文 বাংলা
বাংলা हिन्दी
 Čeština
 Українська
 Română

The direction of the short-term trend on the chart of the US dollar index continues to be set by the downward wave. This started at the beginning of the year. In a larger scale wave model, it takes place on the final segment of the graph (C) on the stretched plane. Given the incompleteness of structure of the main wave, the major scenario for the dollar in the coming months will remain to be under a bearish policy.
The quotations of the index reached a potential reversal area which could give rise to a counter-rollback. The 4-hour chart shows the formation of a correction over the past month. It has a hidden form. The wave lacks the final part. On a small scale, the conditions for the onset of oncoming traffic are only being formed now.
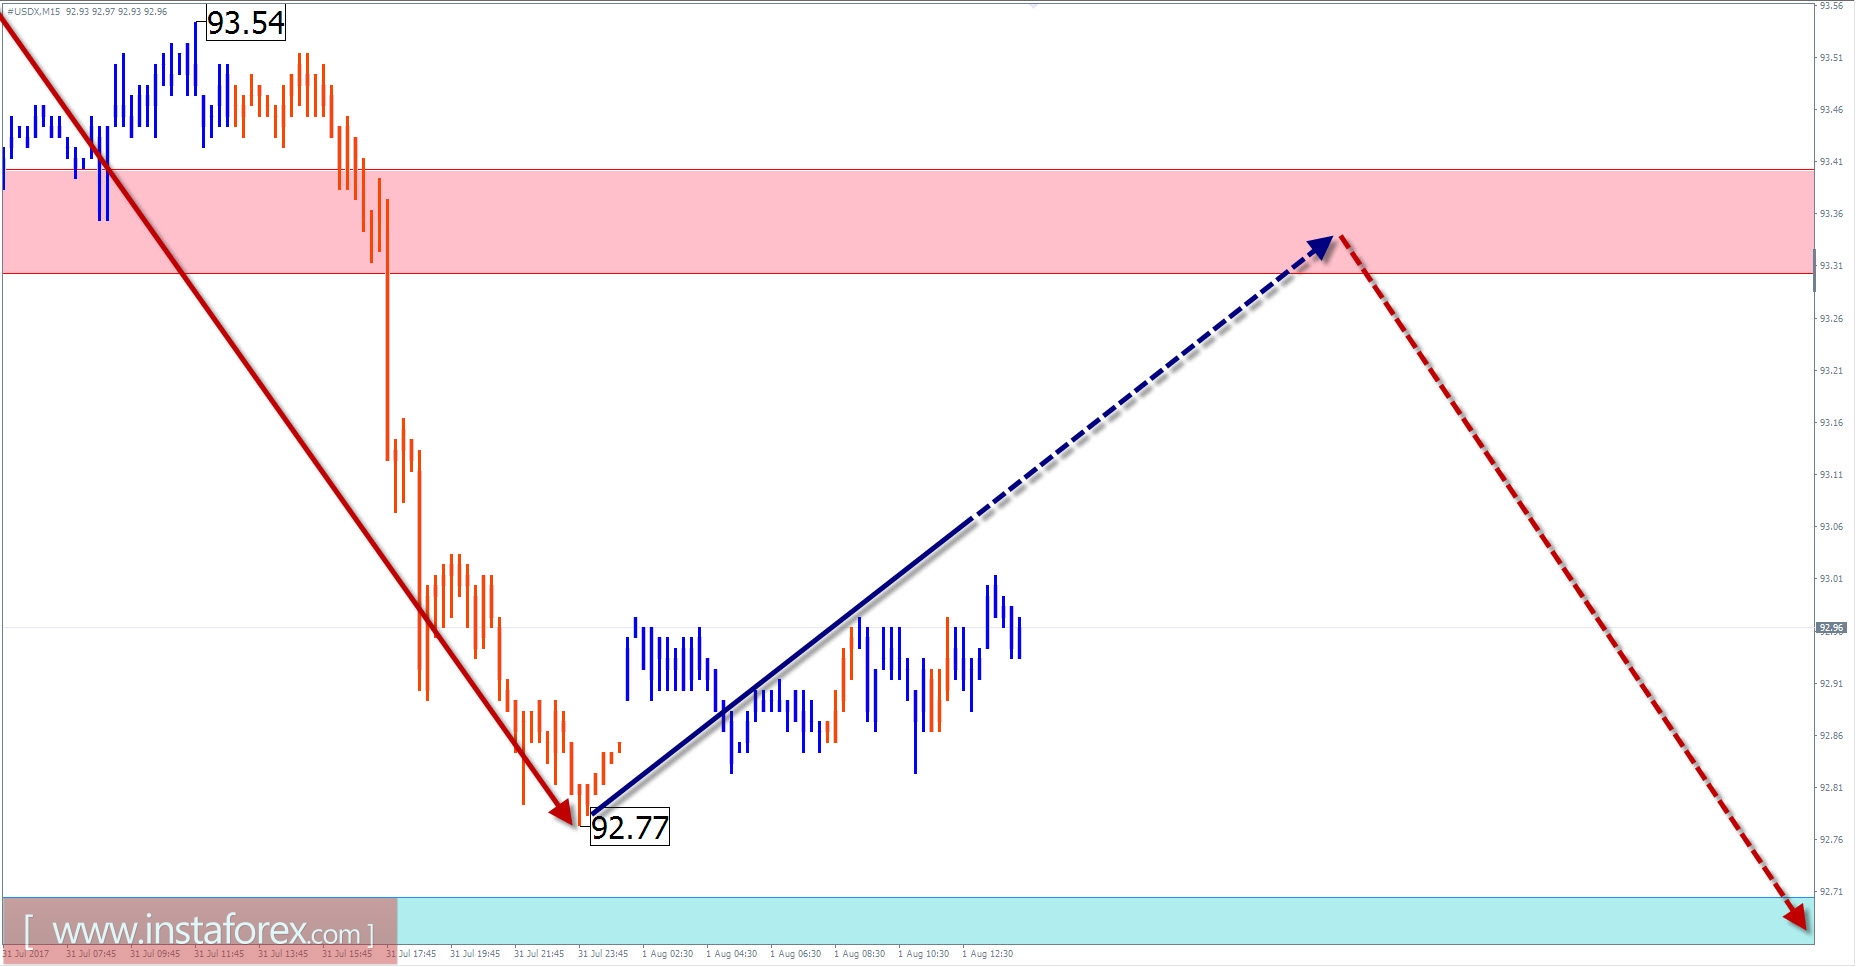
In the next sessions, the dollar's rate may move up, after which, it is necessary to wait for a second attempt to update the local low. The support area limits the scope of the daily decline.
Resistance zone boundaries:
- 93.30 / 40
Support zone boundaries
- 92.70 / 60
Explanation of the figures: For simplified wave analysis, a simple type of wave is used.
The zones are marked on the graphs.
Attention: The wave algorithm does not take into account the duration of the tool movements in time.