English
  Русский
 Bahasa Indonesia
 Bahasa Malay
 ไทย
ไทย Español
 Deutsch
 Български
 Français
 Tiếng Việt
 中文
中文 বাংলা
বাংলা हिन्दी
 Čeština
 Українська
 Română

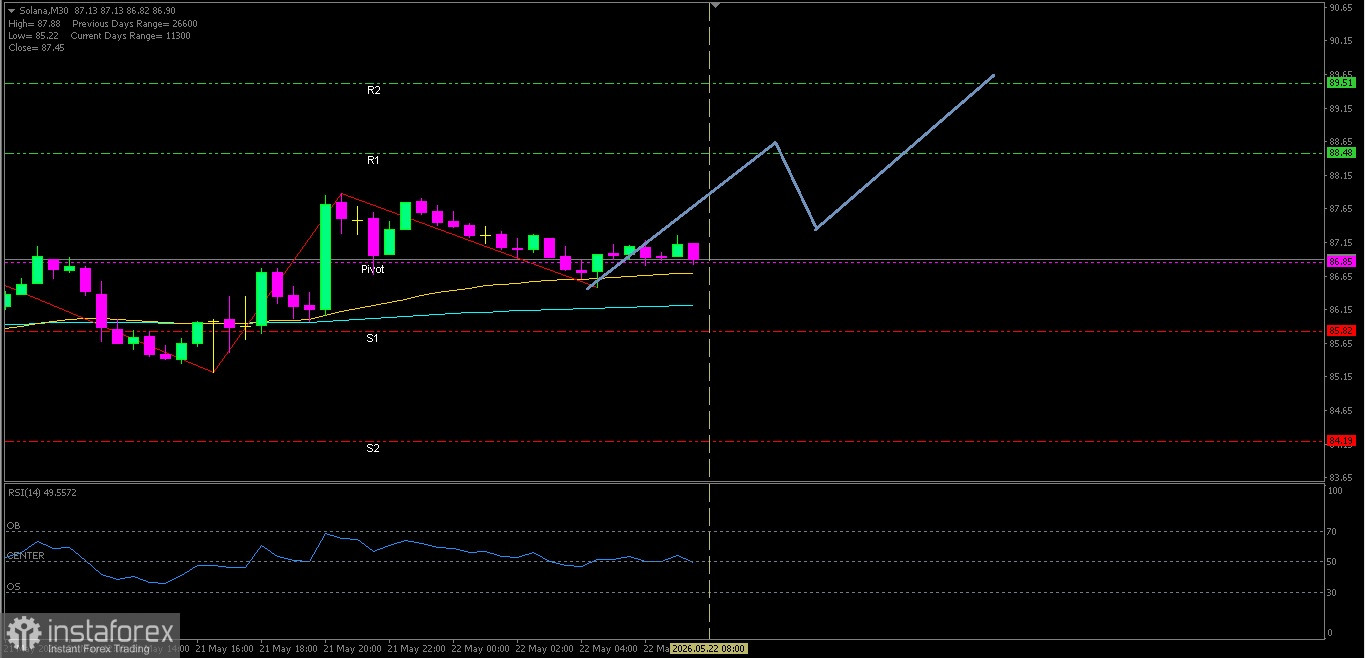
SOLANA
By seeing both EMAs condition which forming a Golden Cross intersection and RSI(14) indicator in the Neutral-Bullish level area, then in the near term Solana has the potential to test its nearest resistance level.
Key Levels
1. Resistance. 2 : 89.51
2. Resistance. 1 : 88.48
3. Pivot : 86.85
4. Support. 1 : 85.82
5. Support. 2 : 84.19
Tactical Scenario
Positive Reaction Zone: If the price holds at 86.85, there is a likelihood of a rise toward 88.48.
Momentum Extension Bias: If 88.48 is broken, Solana could test 89.51.
Invalidation Level / Bias Revision
The upside bias weakens if Solana falls and closes below 84.19.
Technical Summary
EMA(50) : 86.68
EMA(200): 86.21
RSI(14) : 54.18
Economic News Release Agenda:
From the United States the following economic data will be released:
US - Revised UoM Consumer Sentiment - 21:00 WIB
US - CB Leading Index m/m - 21:00 WIB
US - Revised UoM Inflation Expectations - 21:00 WIB