English
  Русский
 Bahasa Indonesia
 Bahasa Malay
 ไทย
ไทย Español
 Deutsch
 Български
 Français
 Tiếng Việt
 中文
中文 বাংলা
বাংলা हिन्दी
 Čeština
 Українська
 Română

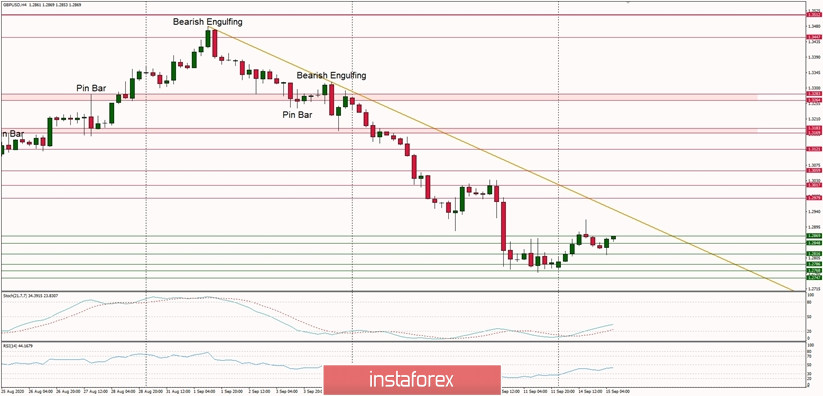
Technical Market Outlook:
The GBP/USD pair has hit the level of 1.2768 twice, which is a part of the key short-term demand zone located between the levels of 1.2747 - 1.2889. Any clear violation of this zone will lead to sell-off continuation towards the level of 1.2604 - 1.2587 which is the key long-term support. Moreover, the market keeps trading below the trend line despite the oversold conditions, so the bears are in full control of the market. The immediate technical resistance is seen at the level of 1.2979 - 1.3017.
Weekly Pivot Points:
WR3 - 1.3535
WR2 - 1.3399
WR1 - 1.3036
Weekly Pivot - 1.2895
WS1 - 1.2525
WS2 - 1.2380
WS3 - 1.1994
Trading Recommendations:
On the GBP/USD pair the main, multi-year trend is down, which can be confirmed by the down candles on the monthly time frame chart. The key long-term technical resistance is still seen at the level of 1.3518. Only if one of these levels is clearly violated, the main trend might reverse (1.3518 is the reversal level) or accelerate towards the key long-term technical support is seen at the level of 1.1903 (1.2589 is the key technical support for this scenario).