 English
  Русский
 Bahasa Indonesia
 Bahasa Malay
 ไทย
ไทย Español
 Deutsch
 Български
 Français
 Tiếng Việt
 中文
中文 বাংলা
বাংলা हिन्दी
 Čeština
 Українська
 Română

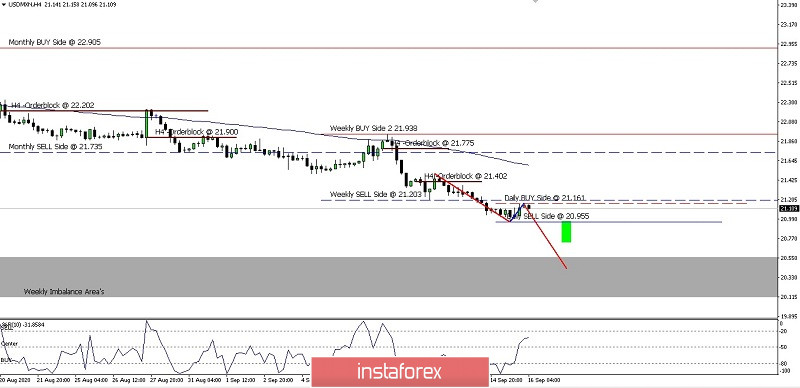
On the 4 hour chart, we can see that the USD/MXN is trading wit the bearish bias. It may decline to the first target at the 20.955 level and the Imbalance Area's (grey area) 20.559 - 20.105 levels as its second target. It is moving below the Moving Average. This scenario will come true if the pair does not rise and fix above the 20.161 level.
(Disclaimer)