 English
  Русский
 Bahasa Indonesia
 Bahasa Malay
 ไทย
ไทย Español
 Deutsch
 Български
 Français
 Tiếng Việt
 中文
中文 বাংলা
বাংলা हिन्दी
 Čeština
 Українська
 Română

GBP/JPY
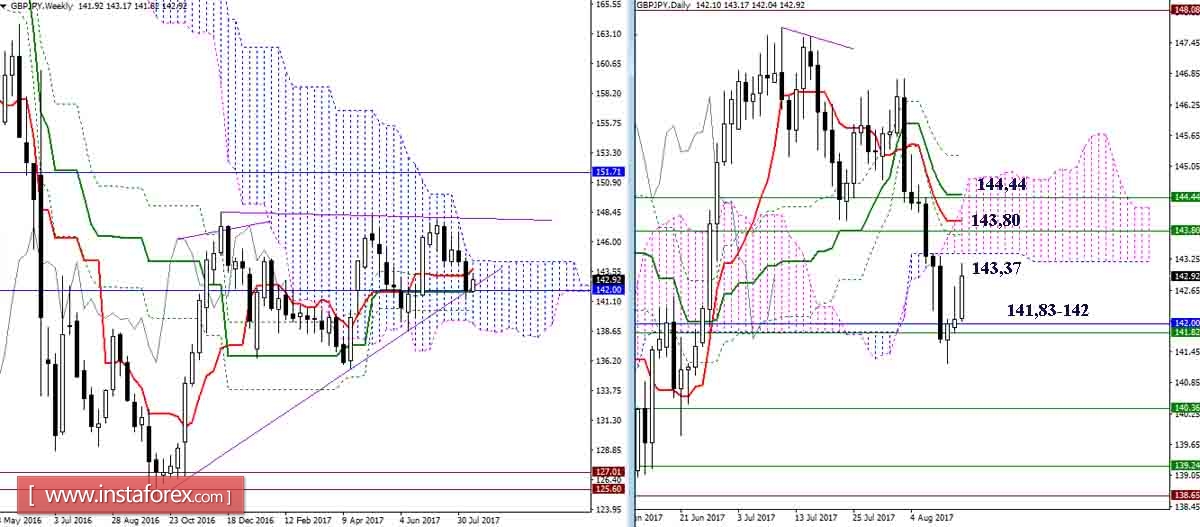
The previously met support (141.83 - 142.00 week-old Kijun + monthly Tenkan + trend line) continue to help players to raise. As a result, the pair performs a retest of the day's cloud passed (the nearest border is 143.37). The resistance of the cloud is currently reinforced by the daily cross and weekly levels (Tenkan 143.80 + Senkou Span B 144.44).
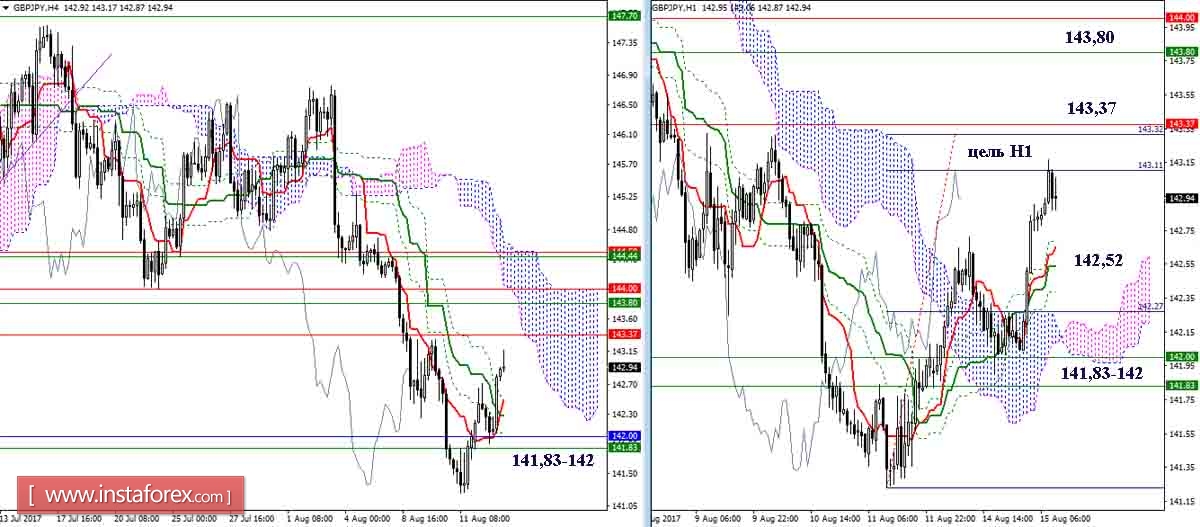
The pair used the key support to overcome the H1 cloud, having already completed the target for the breakdown on the first target, and also eliminated the dead cross H4. Now players on the rise have approached a rather wide and reinforced resistance zone (143.37 - 143.80 - 144.44), any of which levels can serve as the completion of the upward movement. The breakdown of the zone will form new upward guidance points and will require a new assessment of the situation.
EUR / JPY
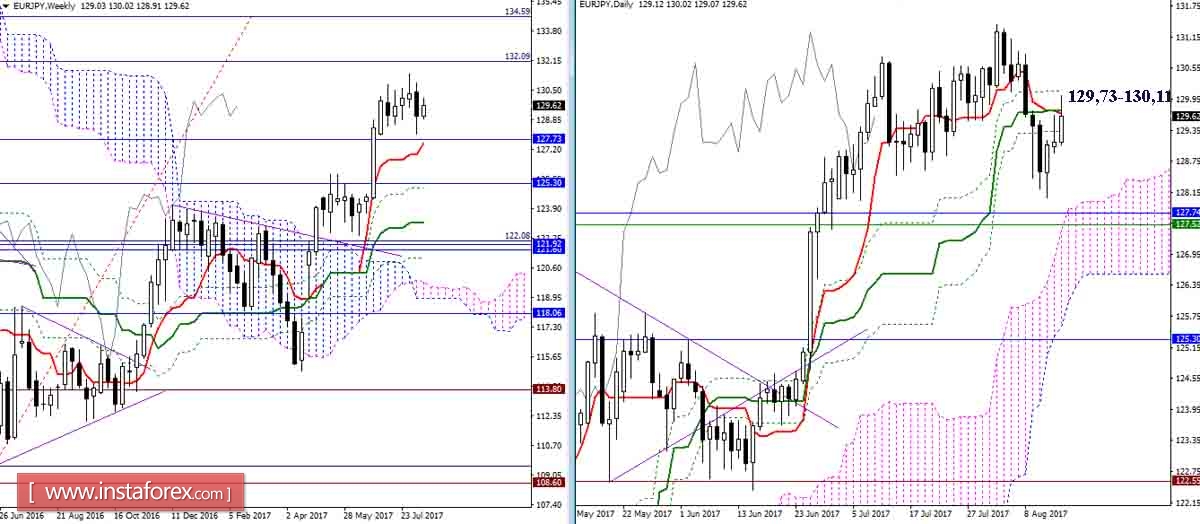
After breaking the day's cross, the pair returned for retest to its levels (Kijun 129.71 + Fibo Kijun 130.11). Testing the cross should determine further plans and options for development. It is now desirable for bears to use these levels to form a rebound, in order to continue with a new strength to a day cloud reinforced with higher-level levels (127.52 week Tenkan + month Fibo Kijun 127.73). The fastening above the day's cross will give hope to the players for a raise and may slow the rivals' plans.
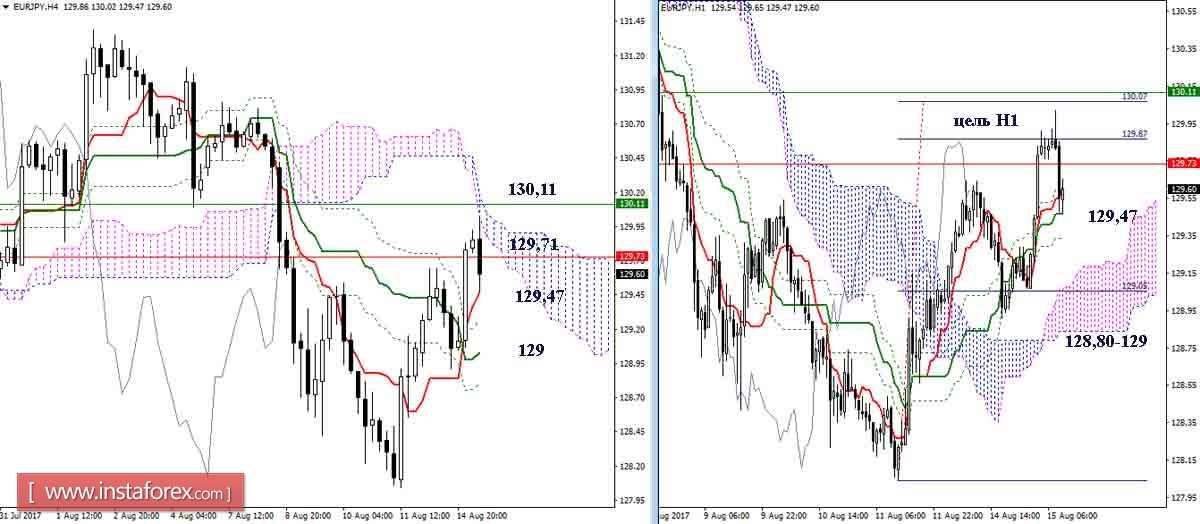
The players on the rise performed the target for the breakdown of the H1 cloud and reached the most important resistances of 129.71-130.11 (cloud H4 + high-time levels). Overcoming of resistances will form a new upward target (target for H4 cloud breakdown) and opens the way for testing the maximum extremum (131.39). Among the supports today, it should be noted 129.47 (Tenkan N4 + cross N1) and 129 (Kijun N4 + cloud H1).
Indicator parameters:
All time intervals 9 - 26 - 52
Color of the indicator lines:
Tenkan (short-term trend) - red,
Kijun (medium-term trend) - green,
Fibo Kijun - green dotted line,
Chinkou - gray,
Clouds: Senkou Span B (SSB, long-term Trend) - blue,
Senkou Span A (SSA) - pink.
The color of the additional lines:
Support and resistance MN - blue, W1 - green, D1 - red, H4 - pink, H1 - gray,
Horizontal levels (not Ichimoku) - brown,
Trend lines - purple.