English
  Русский
 Bahasa Indonesia
 Bahasa Malay
 ไทย
ไทย Español
 Deutsch
 Български
 Français
 Tiếng Việt
 中文
中文 বাংলা
বাংলা हिन्दी
 Čeština
 Українська
 Română

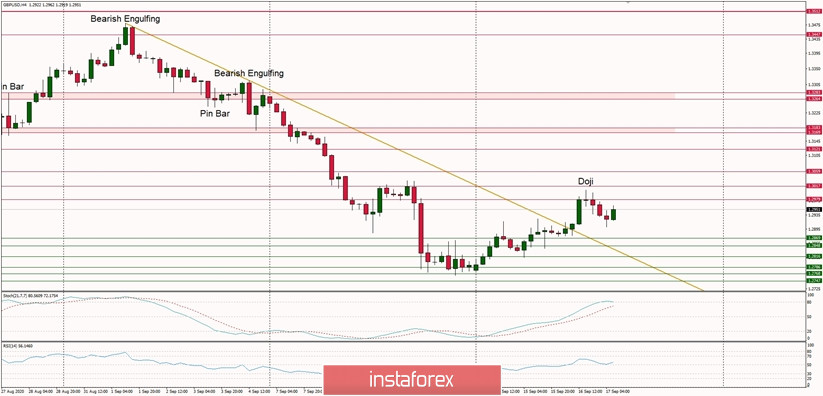
Technical Market Outlook:
The GBP/USD pair has broken through the short-term trend line resistance located at the level of 1.2900 and made a new local high at the level of 1.3006. The violation of this line had put bulls in control of the market and another wave up will develop. For now, the immediate technical resistance is seen at the level of 1.2979 - 1.3017 and it should temporary stop any bullish attempts. The intraday technical support is seen at the levels of 1.2869, 1.2848 and 1.2816.
Weekly Pivot Points:
WR3 - 1.3535
WR2 - 1.3399
WR1 - 1.3036
Weekly Pivot - 1.2895
WS1 - 1.2525
WS2 - 1.2380
WS3 - 1.1994
Trading Recommendations:
On the GBP/USD pair the main, multi-year trend is down, which can be confirmed by the down candles on the monthly time frame chart. The key long-term technical resistance is still seen at the level of 1.3518. Only if one of these levels is clearly violated, the main trend might reverse (1.3518 is the reversal level) or accelerate towards the key long-term technical support is seen at the level of 1.1903 (1.2589 is the key technical support for this scenario).