 English
  Русский
 Bahasa Indonesia
 Bahasa Malay
 ไทย
ไทย Español
 Deutsch
 Български
 Français
 Tiếng Việt
 中文
中文 বাংলা
বাংলা हिन्दी
 Čeština
 Українська
 Română

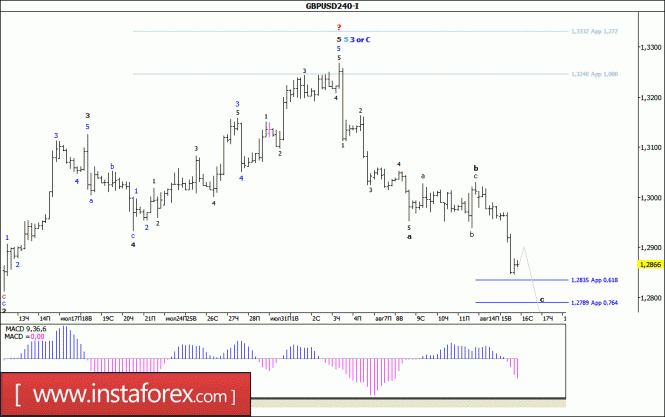
Analysis of wave counting:
Yesterday's GBP / USD trades started with a downward movement. After losing more than 120 percentage points, it dropped to the level of 1.2845 in the afternoon. Thus, it can be assumed that the currency pair did not give the wave (b) in a form of a horizontal triangle with a decreasing corrective structure that originated from the maximum on August 3. As a result of this decline, it passed to the stage of wave (s) formation. If this happens, the ratio between the dimensions of waves a and c in a downward correction allows the probability of the continuation of a decrease in quotations to the level of 1.2790 or even almost to the level of the 27th figure.
Objectives for building a downward wave:
1,2835 - 61,8% by Fibonacci
1,2789 - 76.4% Fibonacci retracement
Goals for building an upward wave:
1,3000 - 1,3100
General conclusions and trade recommendations:
The British currency may have completed the construction of wave 3 or C in the upward trend section. In this case, it may be necessary to adjust the internal structure of this wave which is more complicated. The last section of the trend is a three-wave correctional structure a-b-c. Thus, the decline of quotations will continue with targets near the estimated levels of 1.2835 and 1.2789 that corresponds to 61.8% and 76.4% Fibonacci within the wave (s).