 English
  Русский
 Bahasa Indonesia
 Bahasa Malay
 ไทย
ไทย Español
 Deutsch
 Български
 Français
 Tiếng Việt
 中文
中文 বাংলা
বাংলা हिन्दी
 Čeština
 Українська
 Română

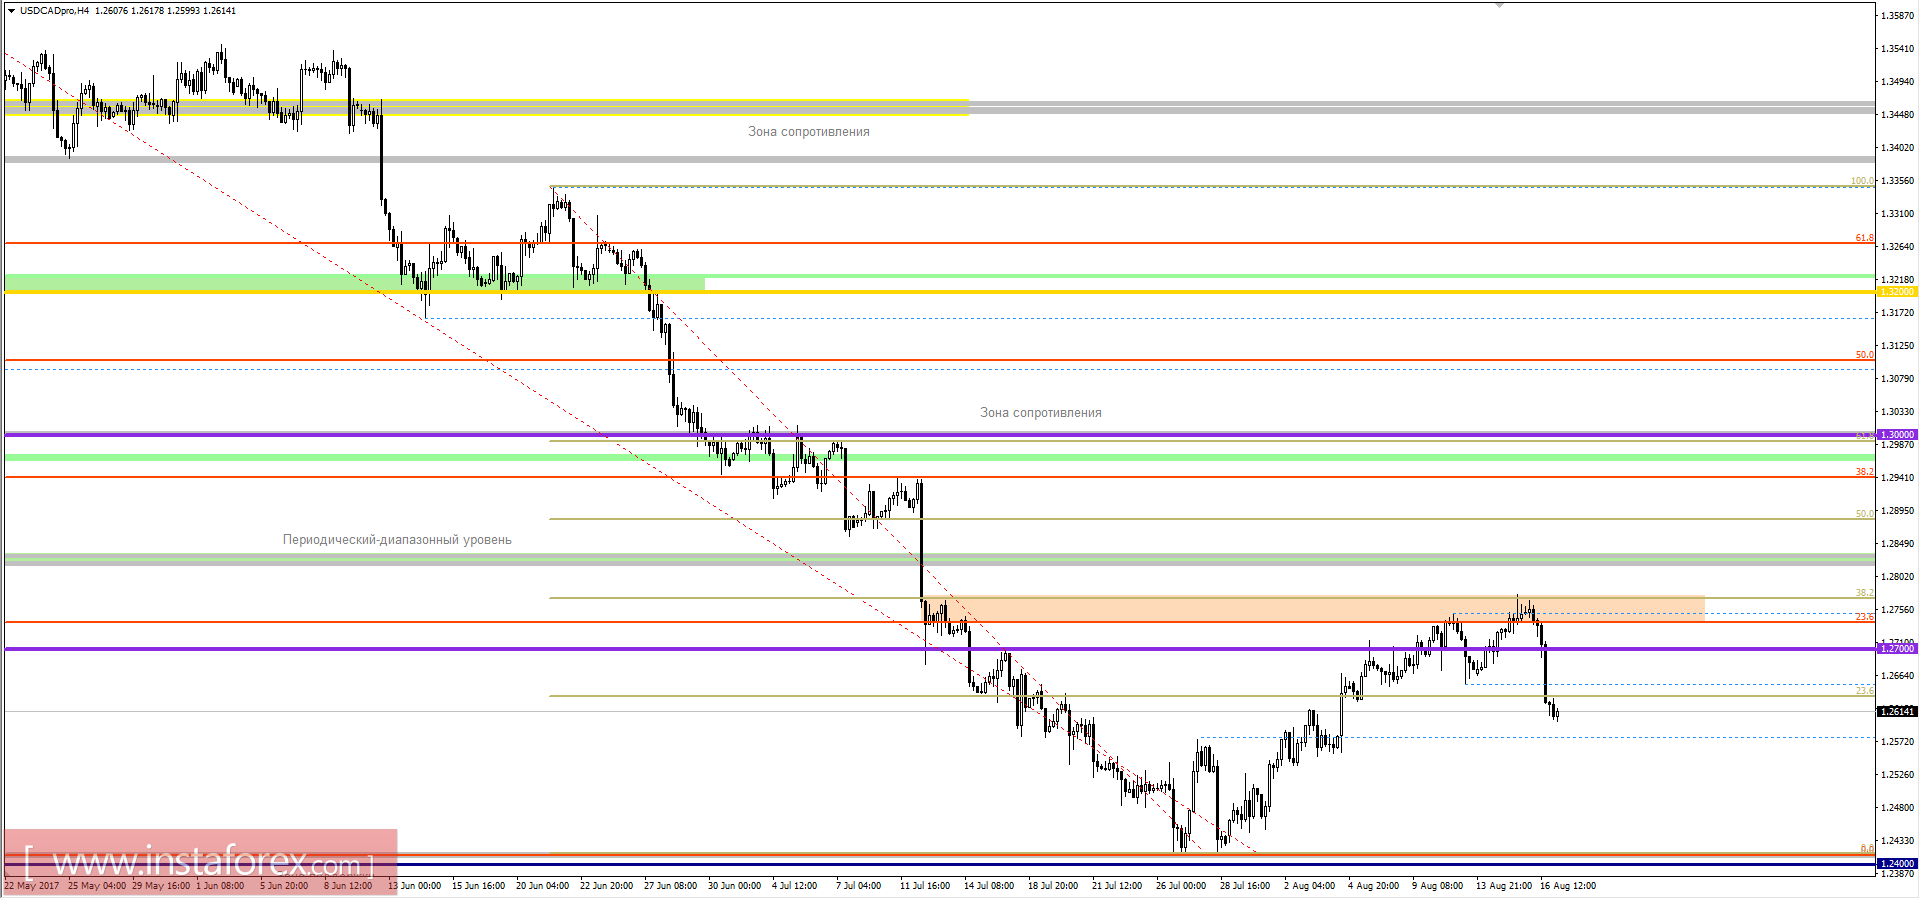
On the four-hour chart, we can observe an intense downward movement, where the currency pair, gaining from the value of 1.2770 (a cluster of Fibo levels), jerked down, drawing a pulse candle. Now we see how the quotation slightly reduced volatility, but still holding a "bearish" interest. Probably assume that we will see a temporary pullback or a stagnation within the values of 1.2580 / 1.2635, where the "bears" will try to regroup and again return to the market. In case of a coincidence of the forecast, we expect further downward movement to the values of 1.2500 / 1.2420
Key levels
Resistance - 1.2700; 1.2840; 1.3000 (+/- 30p).
Support - 1,2400; 1.2200; 1.2000.
Signals
- Buying a pair is recommended to make at a price above 1.2660, with the prospect of a move to 1.2700 / 1.2750.
- Selling a pair is recommended to be made at a price below 1.2580, with the prospect of a move to 1.2500 / 1.2420.
Note: Forecasts are not a direct guide to action!