 English
  Русский
 Bahasa Indonesia
 Bahasa Malay
 ไทย
ไทย Español
 Deutsch
 Български
 Français
 Tiếng Việt
 中文
中文 বাংলা
বাংলা हिन्दी
 Čeština
 Українська
 Română

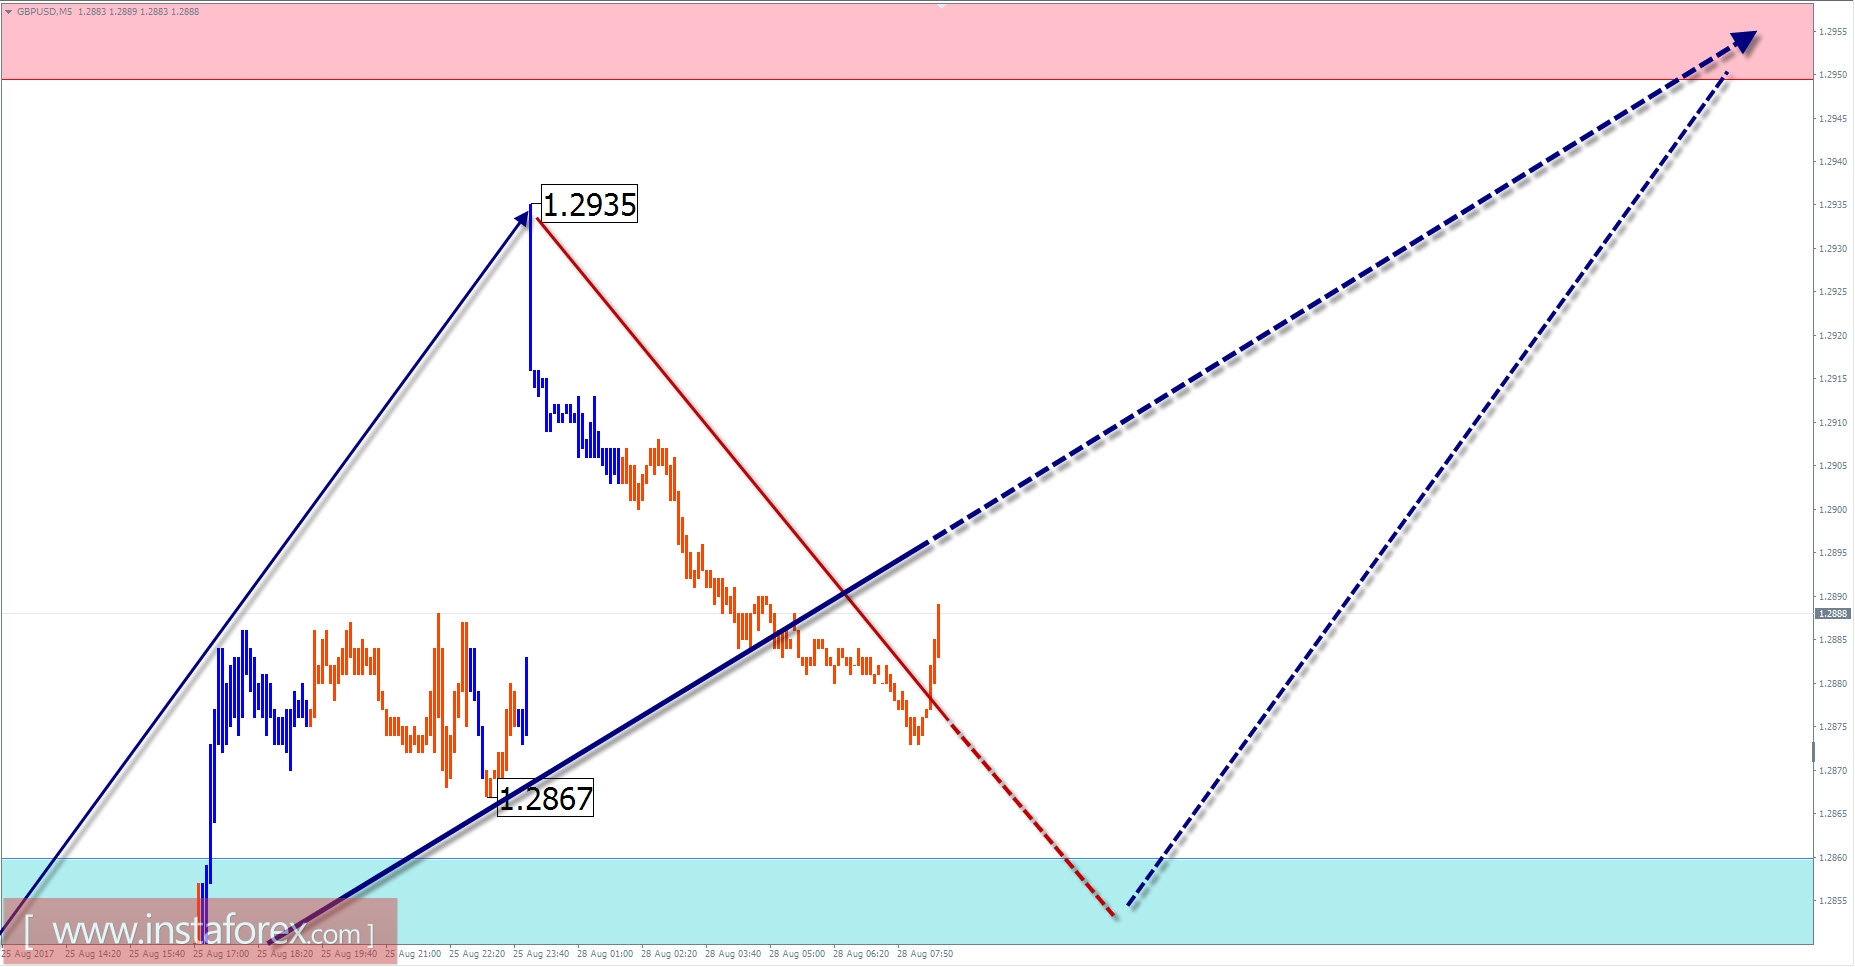
Overview of GBP / USD with the forecast for the current day
On the chart of the British pound, the upward trend since the beginning of the year has reached the preliminary completion zone. The downward wave of August 3 has not exhausted its potential. The bullish section of the movement in the last 2 weeks forms a correction, which will give the current wave a higher wave level. An ascending correction wave has an irregular structure. The jerk at the end of last week formed the final part of the model (C).
For the past weekend, major quotes worked out a decline. A rollback is expected in the coming sessions. After that, you can wait for the beginning of a second attempt to break the price up. The lower boundary of the calculated completion site is within the resistance zone.
The boundaries of the resistance zones:
- 1.2950 / 80
The boundaries of the support zones:
- 1.2860 / 30
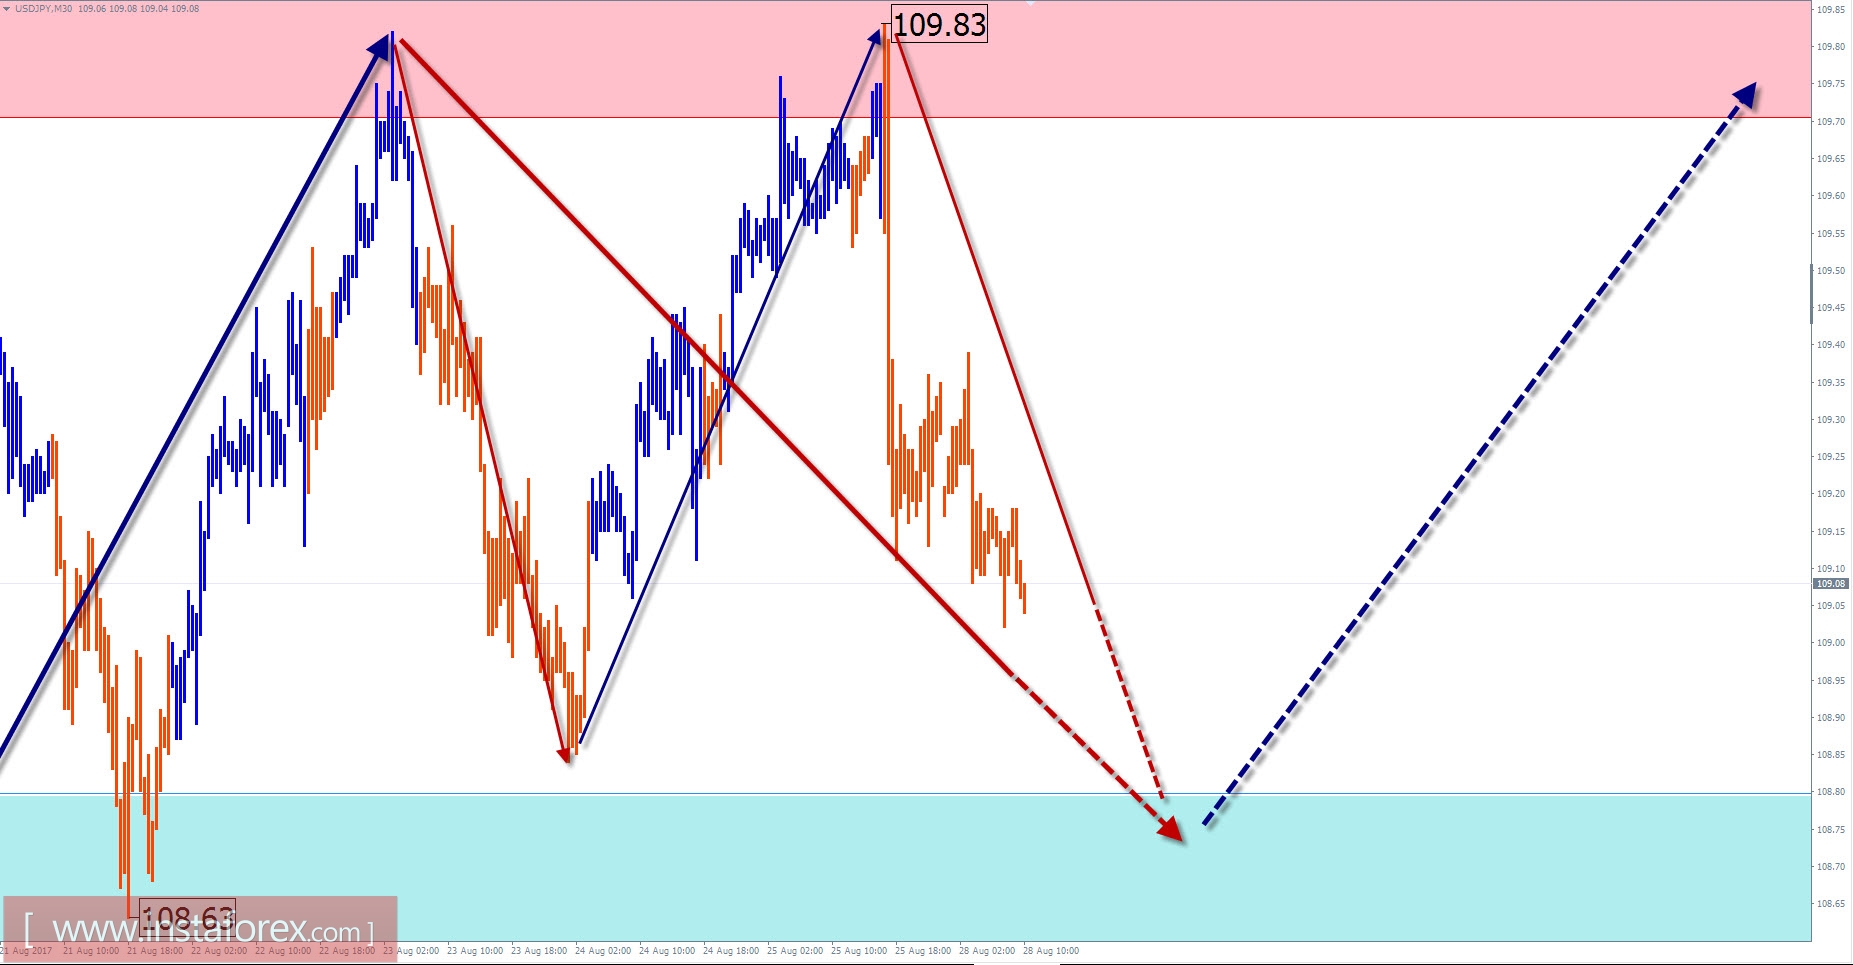
Overview of USD / JPY with the forecast for the current day
The graph of the main pair of Japanese currency in the last 2 years formed the figure of "flat pennant". The range of price movements in recent months has significantly decreased. The analysis indicates the incompleteness of the last bearish wave, which took off in mid-December last year. Within the framework of the movement, a lateral correction in the form of a plane was formed from April. Its lower limit is maintained by a powerful level with a large-scale chart. The probability of its breakthrough down to the completion of the current correction is minimal.
Today, the most likely movement of the tool in the side corridor. In the first half of the day, a decline is more likely, which should be further compensated by price growth by the end of the day.
The boundaries of the resistance zones:
- 109.70 / 110.00
The boundaries of the support zones:
- 108.80 / 50
Explanations to the figures: For simplified wave analysis, a simple type of wave is used that combines 3 parts (A; B; C). Of such waves, all kinds of correction are composed and most of the impulses. On each considered time-frame the last, incomplete wave is analyzed.
The zones marked on the graphs are indicated by the calculation areas in which the probability of a change in the direction of motion is significantly increased. Arrows indicate the wave counting according to the technique used by the author. The solid background of the arrows indicates the structure formed, the dotted line indicates the expected wave motion.
Attention: The wave algorithm does not take into account the duration of the tool movements in time. The forecast is not a trading signal! To conduct a transaction, you need to confirm the signals used by your trading systems.