 English
  Русский
 Bahasa Indonesia
 Bahasa Malay
 ไทย
ไทย Español
 Deutsch
 Български
 Français
 Tiếng Việt
 中文
中文 বাংলা
বাংলা हिन्दी
 Čeština
 Українська
 Română

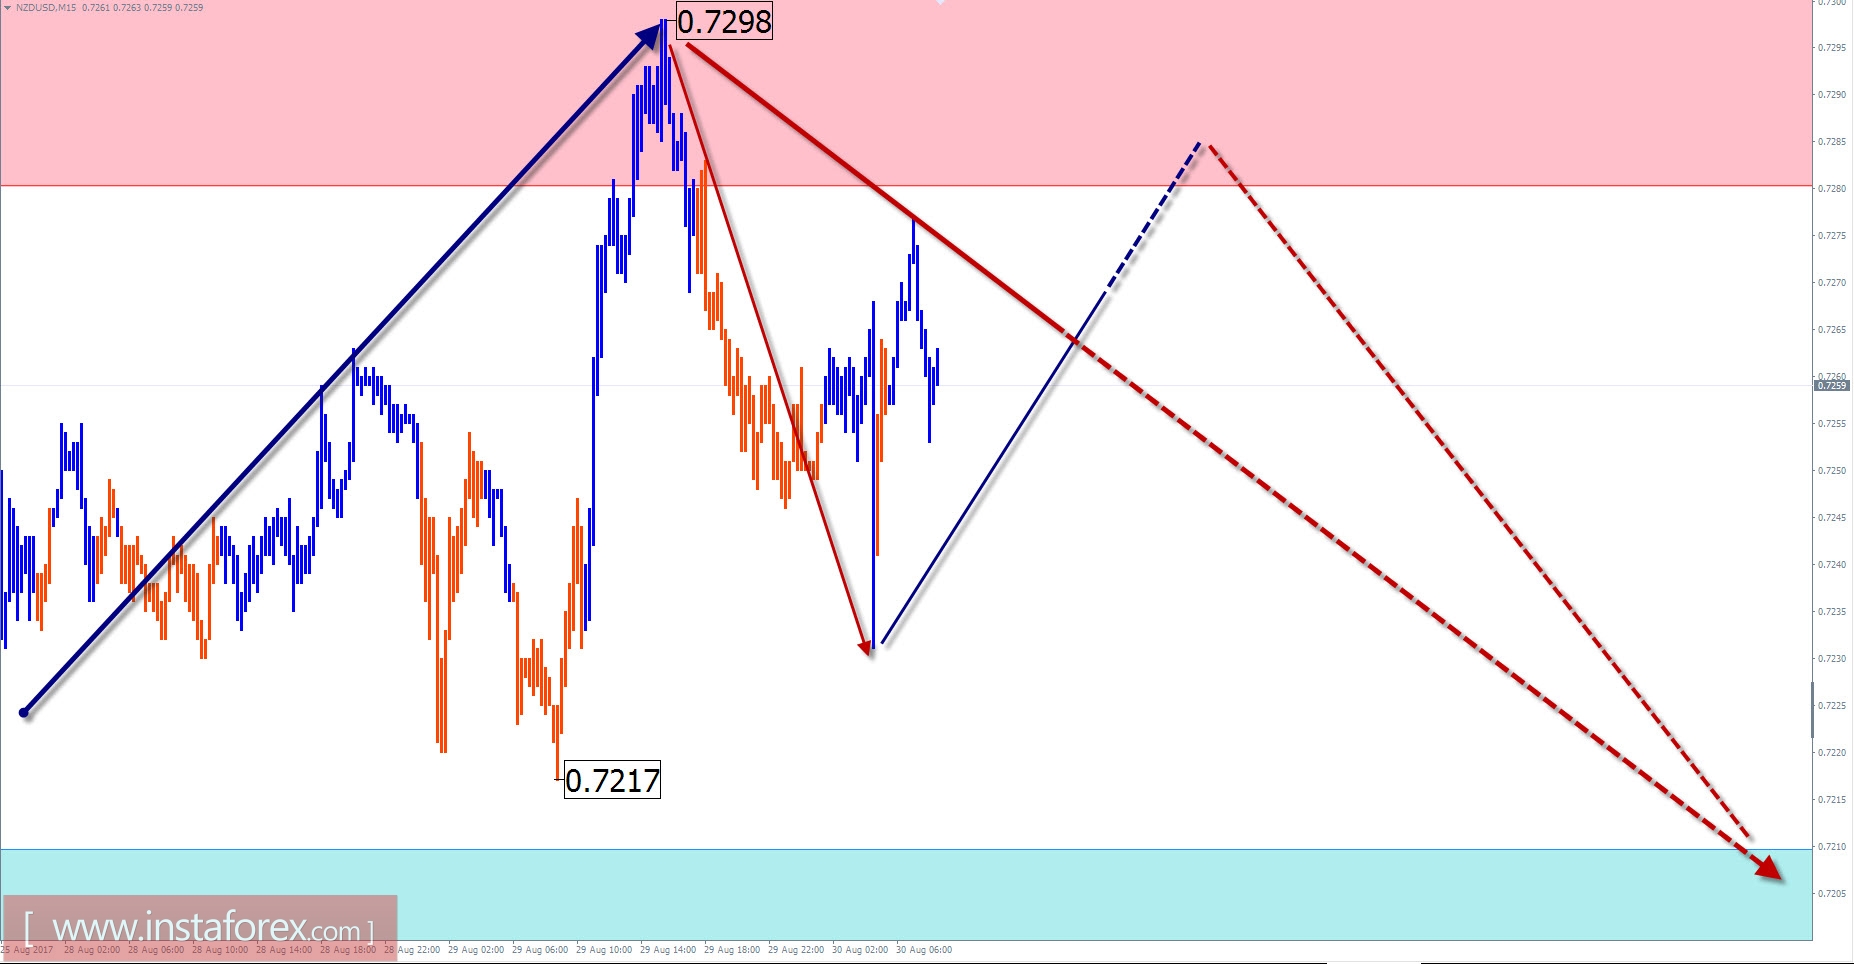
NZD / USD outlook for the current day
On the chart, The direction of the growth of the wave of the New Zealand is in the past two years.
The latest wave design, which is relevant for the short-term perspective, dates back to May 11th.
Today, the continuation of the trend is anticipated towards the end of yesterday.
Boundaries of resistance zones:
- 0.7280 / 0.7310
Support zone boundaries:
- 0.7210 / 0.7180
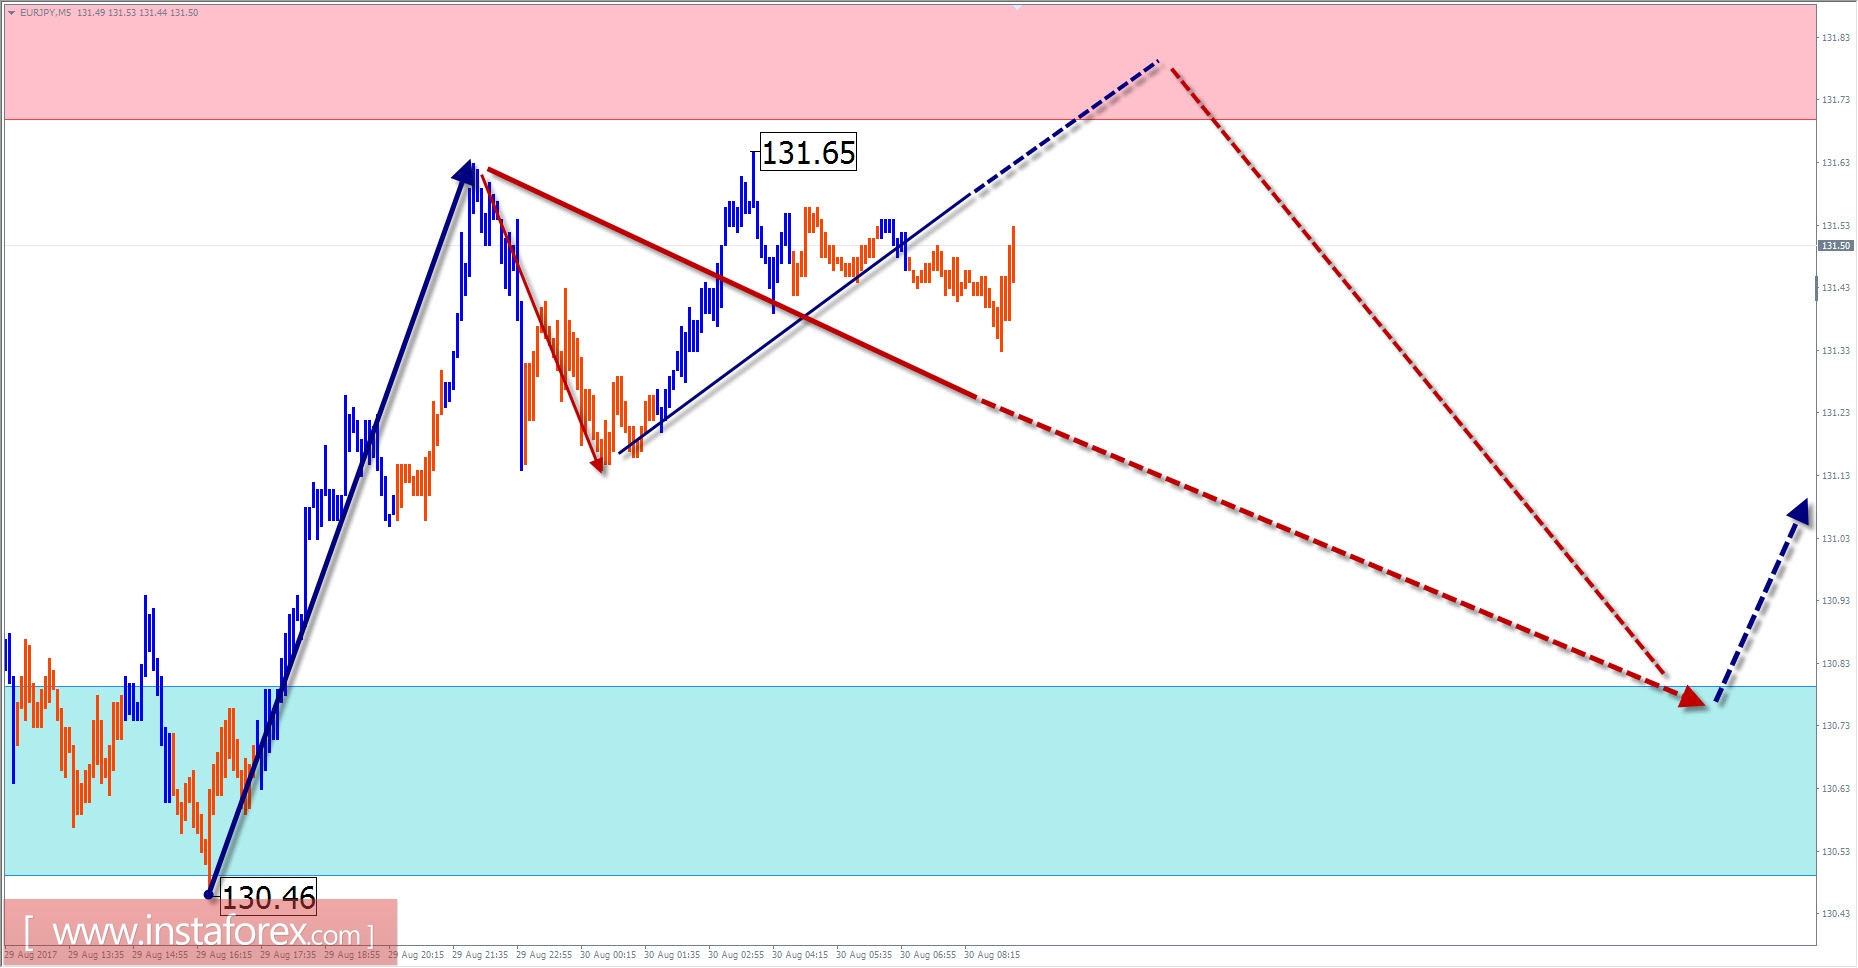
EUR / JPY outlook with current day forecast
In the beginning of the upcoming wave in July of the last year, the EUR / JPY cross pair quotes updated the local maximum on the chart.
After yesterday's upward surge, the price is now expected to correct the movement phase.
Boundaries of resistance zones:
- 131.70 / 132.00
Support zone boundaries:
- 130.80 / 50
Explanations to the figures:
For simplified wave analysis, a simple waveform is used that combines 3 parts namely A, B, and C. All types of correction are created and most of the impulses can be found in these waves. Every time frame is considered and the last incomplete wave is analyzed.
The zones marked on the graphs indicate the probability of a change in the direction of motion has significantly increased as calculated in the areas. Arrows indicate the wave counting following the technique used by the author. A solid background of the arrows signifies the structure has been formed while the dotted one means the expected wave motion.
Attention: The wave algorithm does not take into account the duration of the movement of tools in time. The forecast is not a trading signal! To conduct a bargain, you need to confirm the signals used by your trading systems.