 English
  Русский
 Bahasa Indonesia
 Bahasa Malay
 ไทย
ไทย Español
 Deutsch
 Български
 Français
 Tiếng Việt
 中文
中文 বাংলা
বাংলা हिन्दी
 Čeština
 Українська
 Română

EURUSD is making lower lows and lower highs. Trend remains bearish and today we use the Ichimoku cloud indicator in order to identify the key resistance levels that if broken, could signal a trend change.
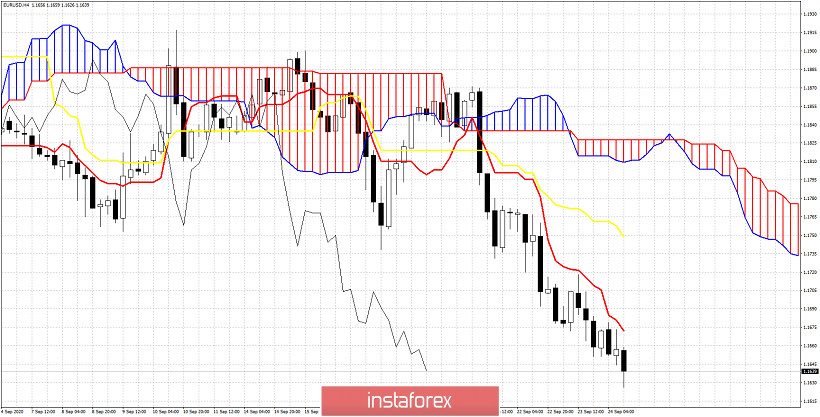
Price is below both the tenkan-sen (red line indicator) and the kijun-sen (yellow line indicator). This confirms bearish trend. Resistance by the tenkan-sen is at 1.1670 and by the kijun-sen at 1.1740. If bulls manage to recapture 1.1670, then we could see price move closer to the kijun-sen. If bulls manage to break above the kijun-sen and stay above it, then we could see a move towarsd the Kumo (Ichimoku cloud) at 1.18. So far there is no sign of such a reversal as price is still away from the tenkan-sen.