 English
  Русский
 Bahasa Indonesia
 Bahasa Malay
 ไทย
ไทย Español
 Deutsch
 Български
 Français
 Tiếng Việt
 中文
中文 বাংলা
বাংলা हिन्दी
 Čeština
 Українська
 Română

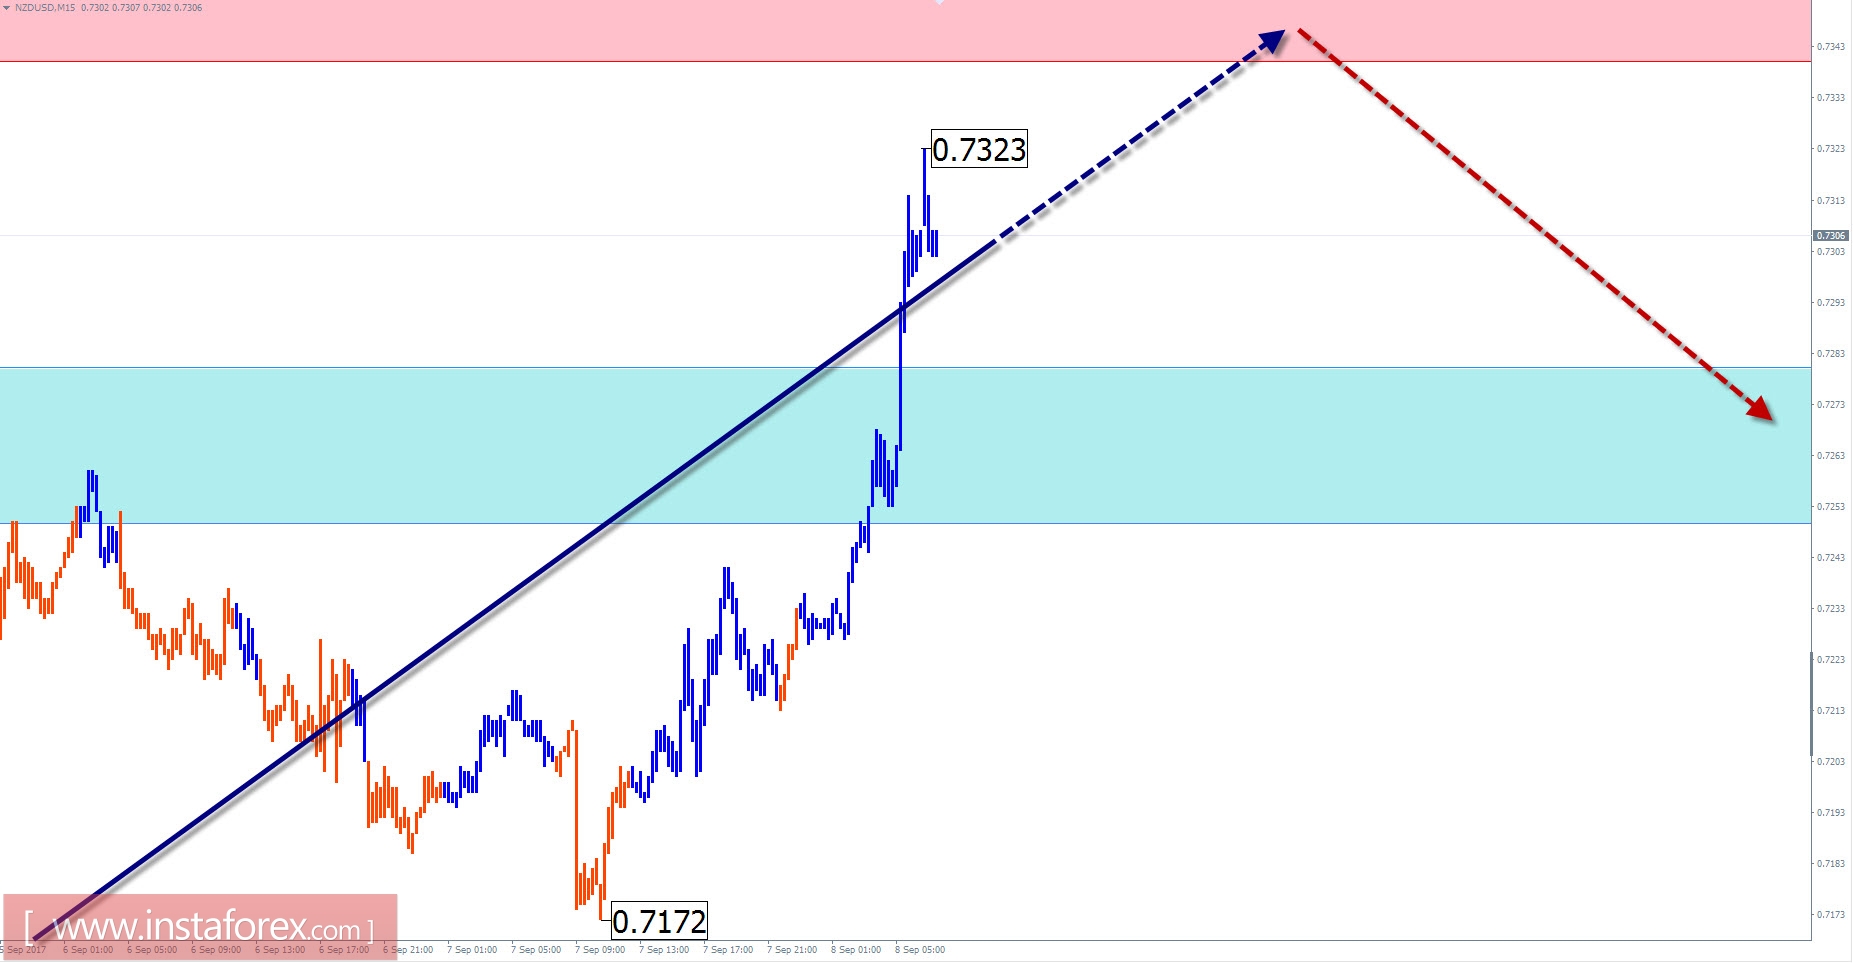
Overview of NZD / USD with a forecast for the current day
At the end of the two-year upward trend of the New Zealand currency, the last incomplete wave for today is forming from the beginning of May. Over the past month, the pair's quotations have been moving downward, creating a corrective plot. The price rise of August 31 formed the middle part of the zigzag. The calculation of the target zone indicates a high probability of completion of the ascent within the nearest potential turn area. The marked resistance zone is within its boundaries.
In the first half of today, the exit of the mood of the price movement is expected to end. We can not exclude the short-term breakthrough of the upper boundary of the resistance zone. The change in direction of the session trend is more likely at the end of the day.
The boundaries of the zones of resistance:
- 0.7340 / 70
The boundaries of the support zones:
- 0.7280 / 50
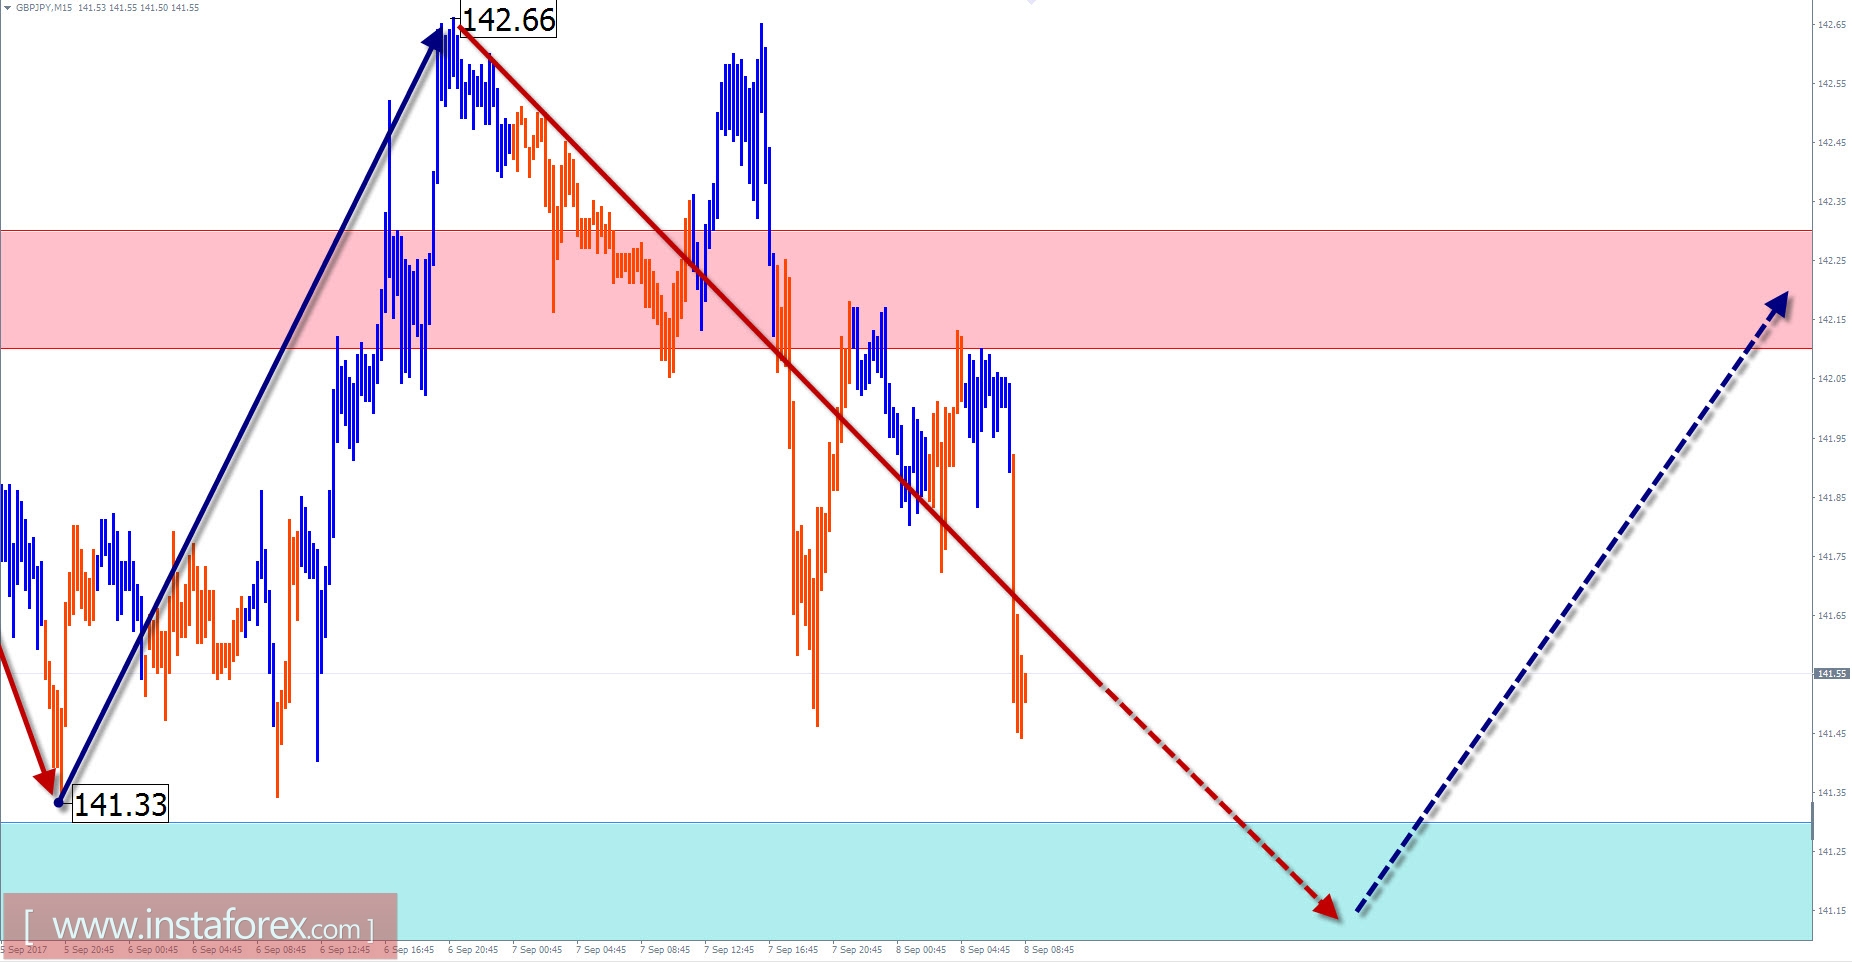
Overview of GBP / JPY with the forecast for the current day
The "upward triangle" formed on the price schedule of the cross since October of last year ended with a breakthrough of its lower limit. Analysis of the wave structure indicates the development of the final segment (C) in the correcting part of the current ascending wave.
The descending wave of July 11 at the end of last month reached a powerful support line, from which the price rebound further went. The structural analysis indicates the incompleteness of the wave. With a high probability, the price quotes of the pair can update the local low on August 24.
In the coming trading sessions, the correction is expected to end. Then there should be a second attempt at price growth. A break of the upper resistance zone boundary is already possible within the current day, but more likely in the next trading week.
The boundaries of the resistance zones:
- 142.10 / 40
The boundaries of support zones:
- 141.30 / 141.00
Explanations to the figures: For simplified wave analysis, a simple waveform is used that combines 3 parts (A; B; C). Of these waves, all kinds of correction are composed and most of the impulses. On each considered time frame the last, incomplete wave is analyzed.
The areas marked in the graphs are indicated by the calculation areas in which the probability of a change in the direction of motion is significantly increased. Arrows indicate the wave counting according to the technique used by the author. The solid background of the arrows indicates the formed structure, the dotted one indicates the expected wave motions.
Attention: The wave algorithm does not take into account the duration of the tool movements in time. The forecast is not a trading signal! To conduct a trade transaction, you need confirmation signals used by your trading systems.