 English
  Русский
 Bahasa Indonesia
 Bahasa Malay
 ไทย
ไทย Español
 Deutsch
 Български
 Français
 Tiếng Việt
 中文
中文 বাংলা
বাংলা हिन्दी
 Čeština
 Українська
 Română

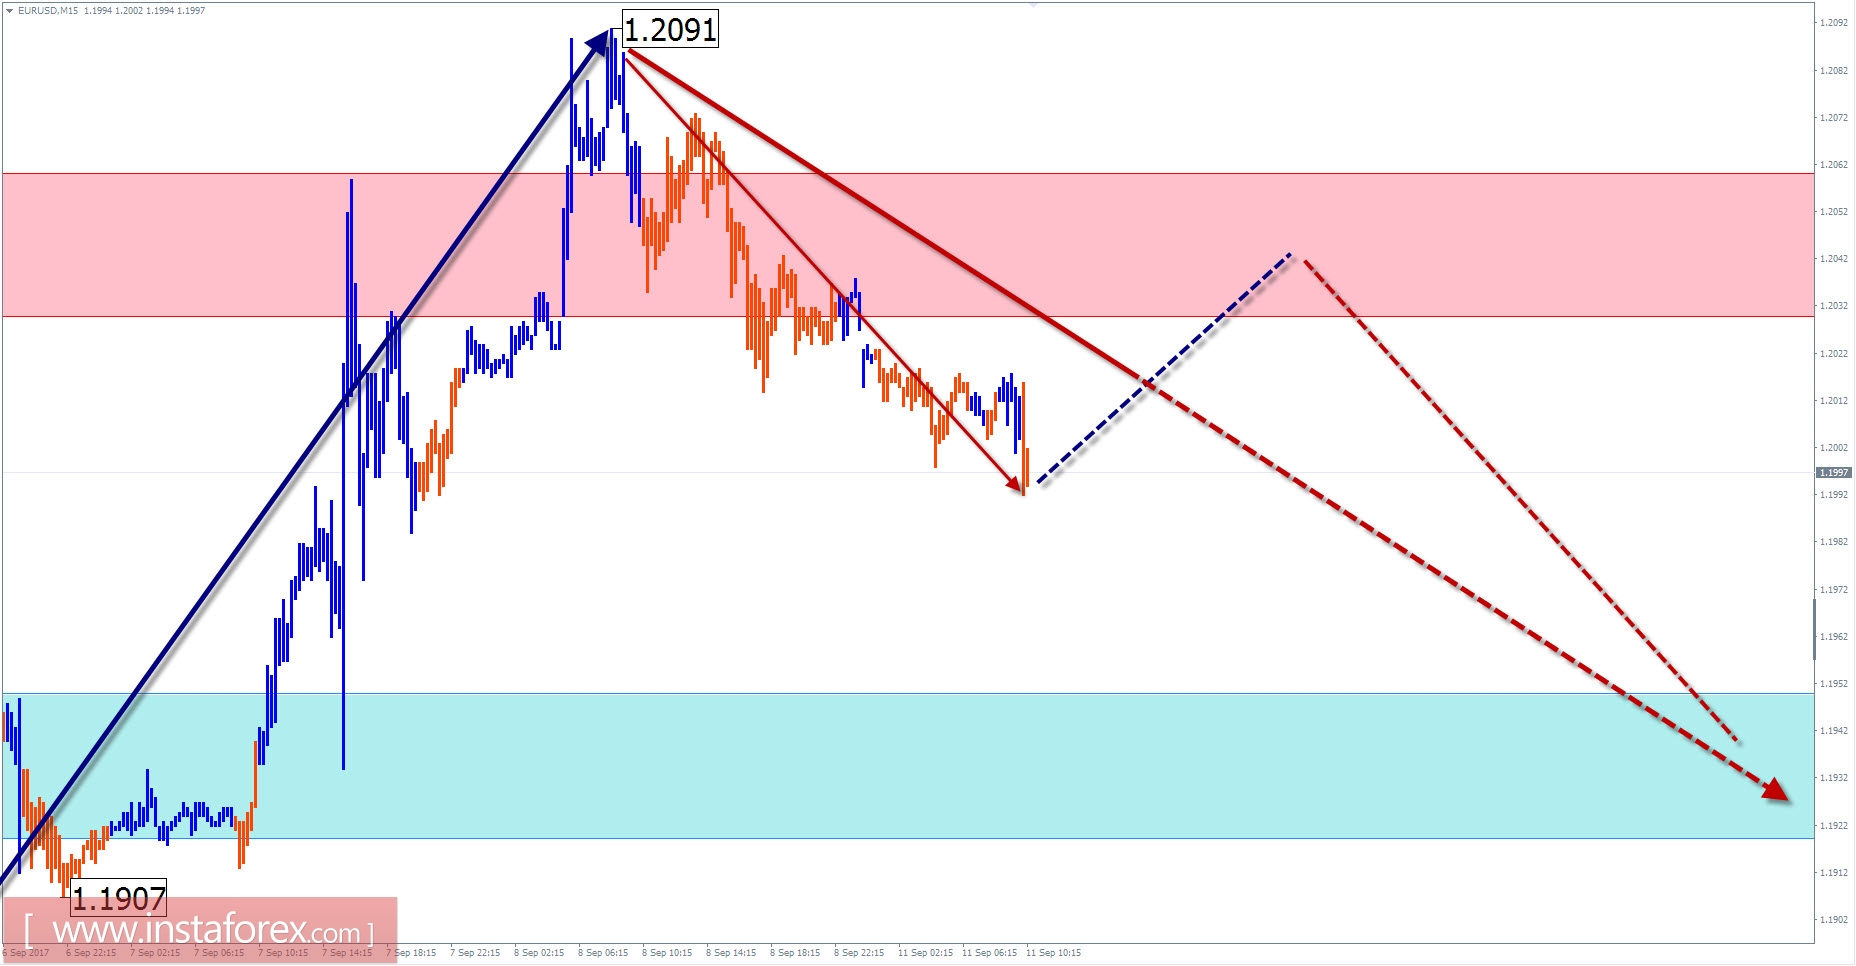
Overview of EUR / USD with a forecast for the current day
The chart of the main pair of the European currency from March 2015 formed a stretched plane. The structure of the whole wave looks complete, the proportions of the parts are observed. Quotations are in the framework of a broad settlement zone, where the probability of completion of the entire wave increases significantly.
The scale approximation shows the last incomplete wave on the tool chart. The descending wave zigzag begins on August 29. At its wave level, the model claims to be a reversal site. The ascending portion forms the middle part of the wave and is close to completion.
Today, in the morning, the most likely is the flattened mood. There may be an ascending vector of oscillations, not beyond the boundaries of the resistance zone. Towards the end of the day, a change in exchange rate is expected, with the pair moving towards the support zone.
The boundaries of the resistance zones:
-1.2030 / 60
The boundaries of the support zones:
-1.1950 / 20
Overview of USD / JPY with a forecast for the current day
The bearish trend on the weekly chart scale of the instrument continues to set the main direction of the price movement. The lower boundary of the powerful support site was squeezed last week, opening the way to the next target zone. Former support was the goal of a rollback. The preliminary calculation allows you to expect the course of the currency pair, at least 2 price figures down from the current rate.
Today, the completion of the price increase that began last Friday is expected. Within the boundaries of the resistance zone, one can expect the formation of a reversal and the beginning of a decline. The lower boundary of the daily volatility of the pair shows the support zone.
The boundaries of the resistance zones:
- 108.80 / 109.10
The boundaries of the support zones:
- 107.90 / 60
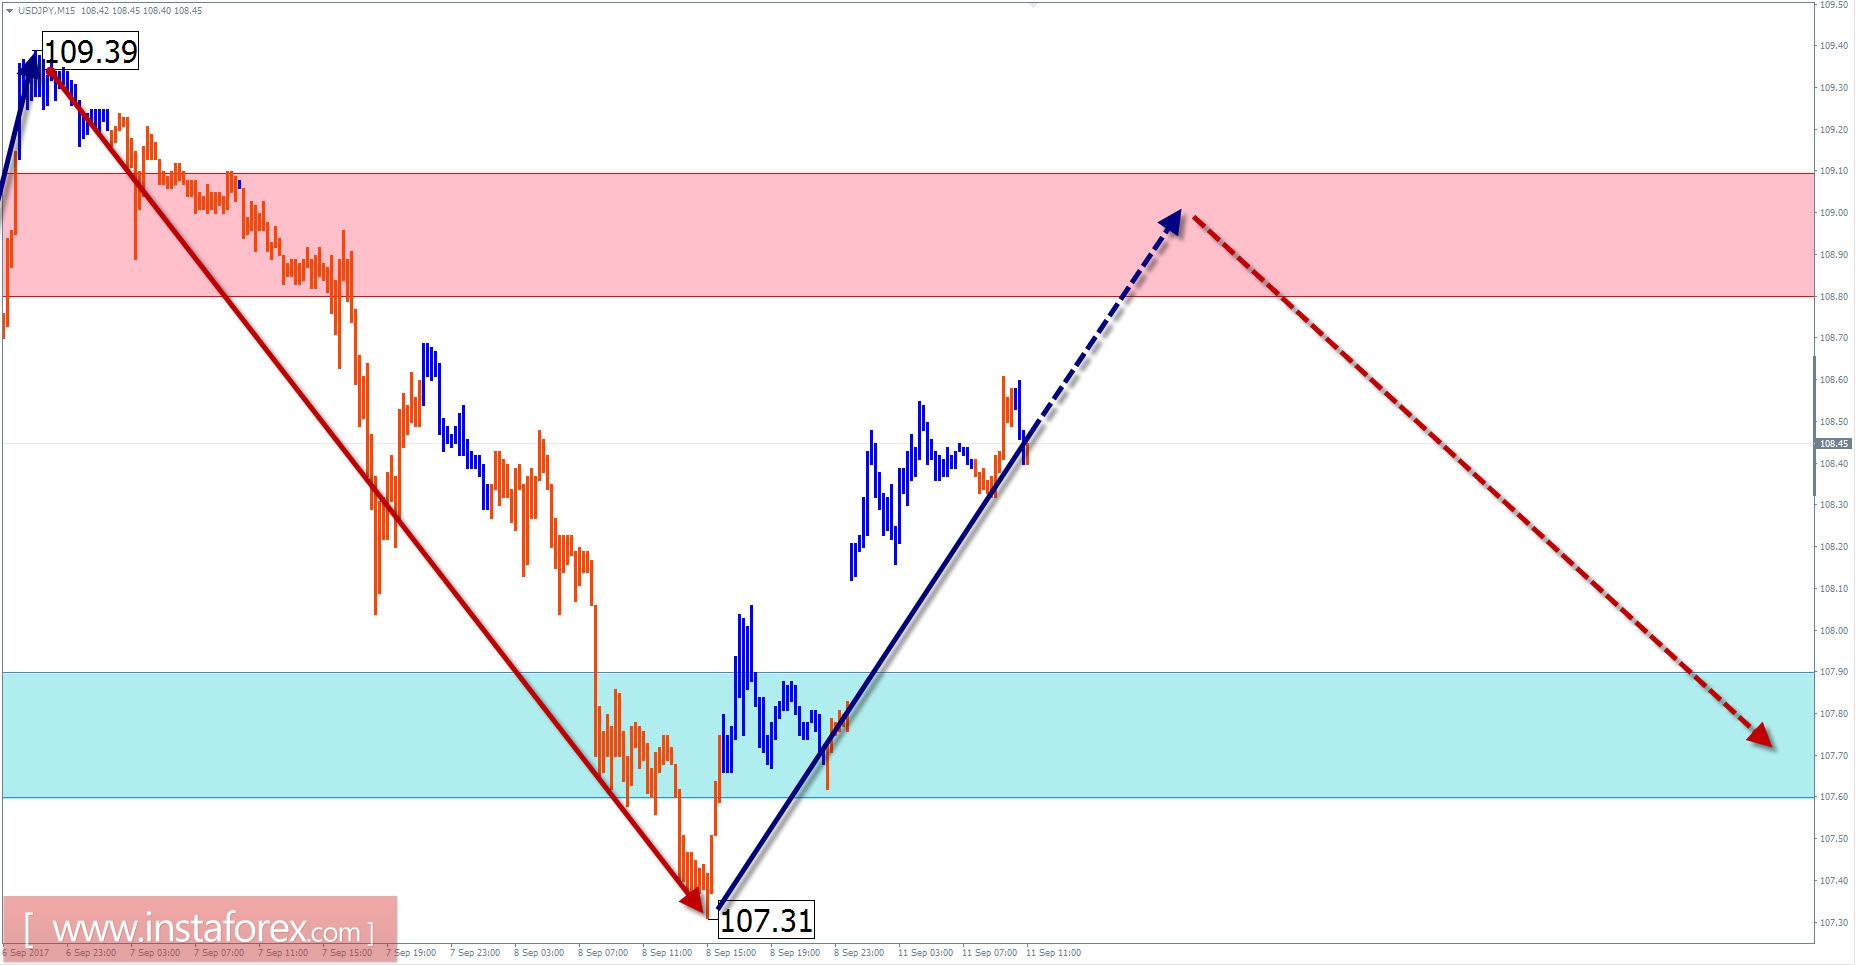
Explanations to the figures: For simplified wave analysis, a simple waveform is used that combines 3 parts (A; B; C). Of these waves, all kinds of correction are composed and most of the impulses. On each considered time frame the last, incomplete wave is analyzed.
The areas marked on the graphs are indicated by the calculation areas in which the probability of a change in the direction of motion is significantly increased. Arrows indicate the wave counting according to the technique used by the author. The solid background of the arrows indicates the structure formed, the dotted one indicates the expected wave motion.
Attention: The wave algorithm does not take into account the duration of the tool movements in time. The forecast is not a trading signal! To conduct a trade transaction, you need to confirm the signals of your trading systems.