 English
  Русский
 Bahasa Indonesia
 Bahasa Malay
 ไทย
ไทย Español
 Deutsch
 Български
 Français
 Tiếng Việt
 中文
中文 বাংলা
বাংলা हिन्दी
 Čeština
 Українська
 Română

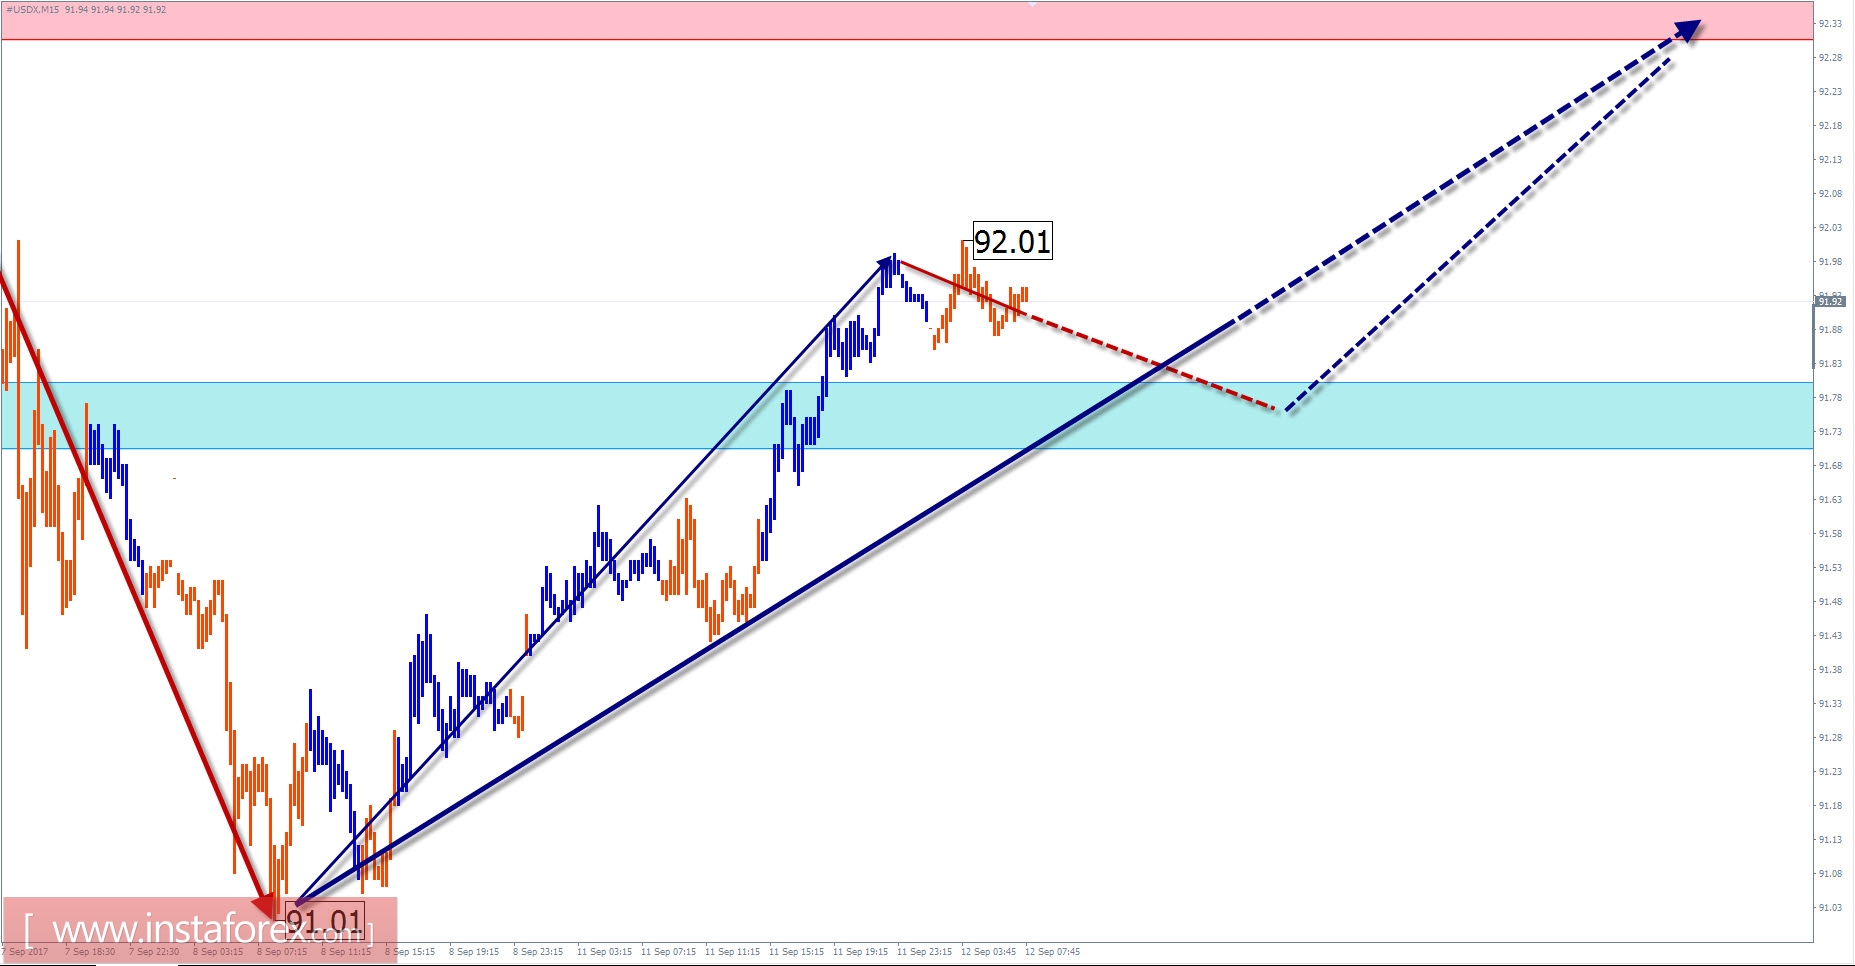
Overview of #USDX (US dollar index) with a forecast for the current day
The chart of the US dollar index from the beginning of this year continues the downward trend. The trend is set by a large corrective descending model, formed an expanded flat. Quotations in the index were within the range of a powerful zone that created support for the weakening dollar. This resulted in a breakdown in the lower boundary which opens the course towards the next target area.
There has been an upward wave zigzag since August 29 where the final part of the movement began to form actively on September 8. The initial goal towards the recovery of the pair has not yet been achieved by the time of the analysis.
The short-term flat tone is not excluded in the next trading session. During this process, there is a possibility for a decrease in the support area. Traders can rely on the continuation of the upward movement towards the end of the day.
Boundaries of resistance zones:
- 92.30 / 40
Boundaries of support zones:
- 91.80 / 70
Review of the NZD / USD pair with a forecast for the current day
The major pair of the New Zealand dollar has not yet been completed in the last wave from the end of July its middle part (B) is formed as shown in the chart of the pair. Hence, a correction section of a lesser scale was formed within the framework of this design.
At the end of last week, a downward pullback started with a potential to start a reversal zigzag. With this option, the price must finish the correction that began yesterday before an active decline to occur.
Today, the direction of the movement that began yesterday is expected to continue. In the morning, there is a possibility for a brief increase to the resistance levels. The nearest support area should limit the scope of daily volatility. At the same time, the option of a breakdown to the lower boundary cannot be ruled out today.
Boundaries of resistance zones:
- 0.7240 / 70
Boundaries of support zones:
- 0.7190 / 60
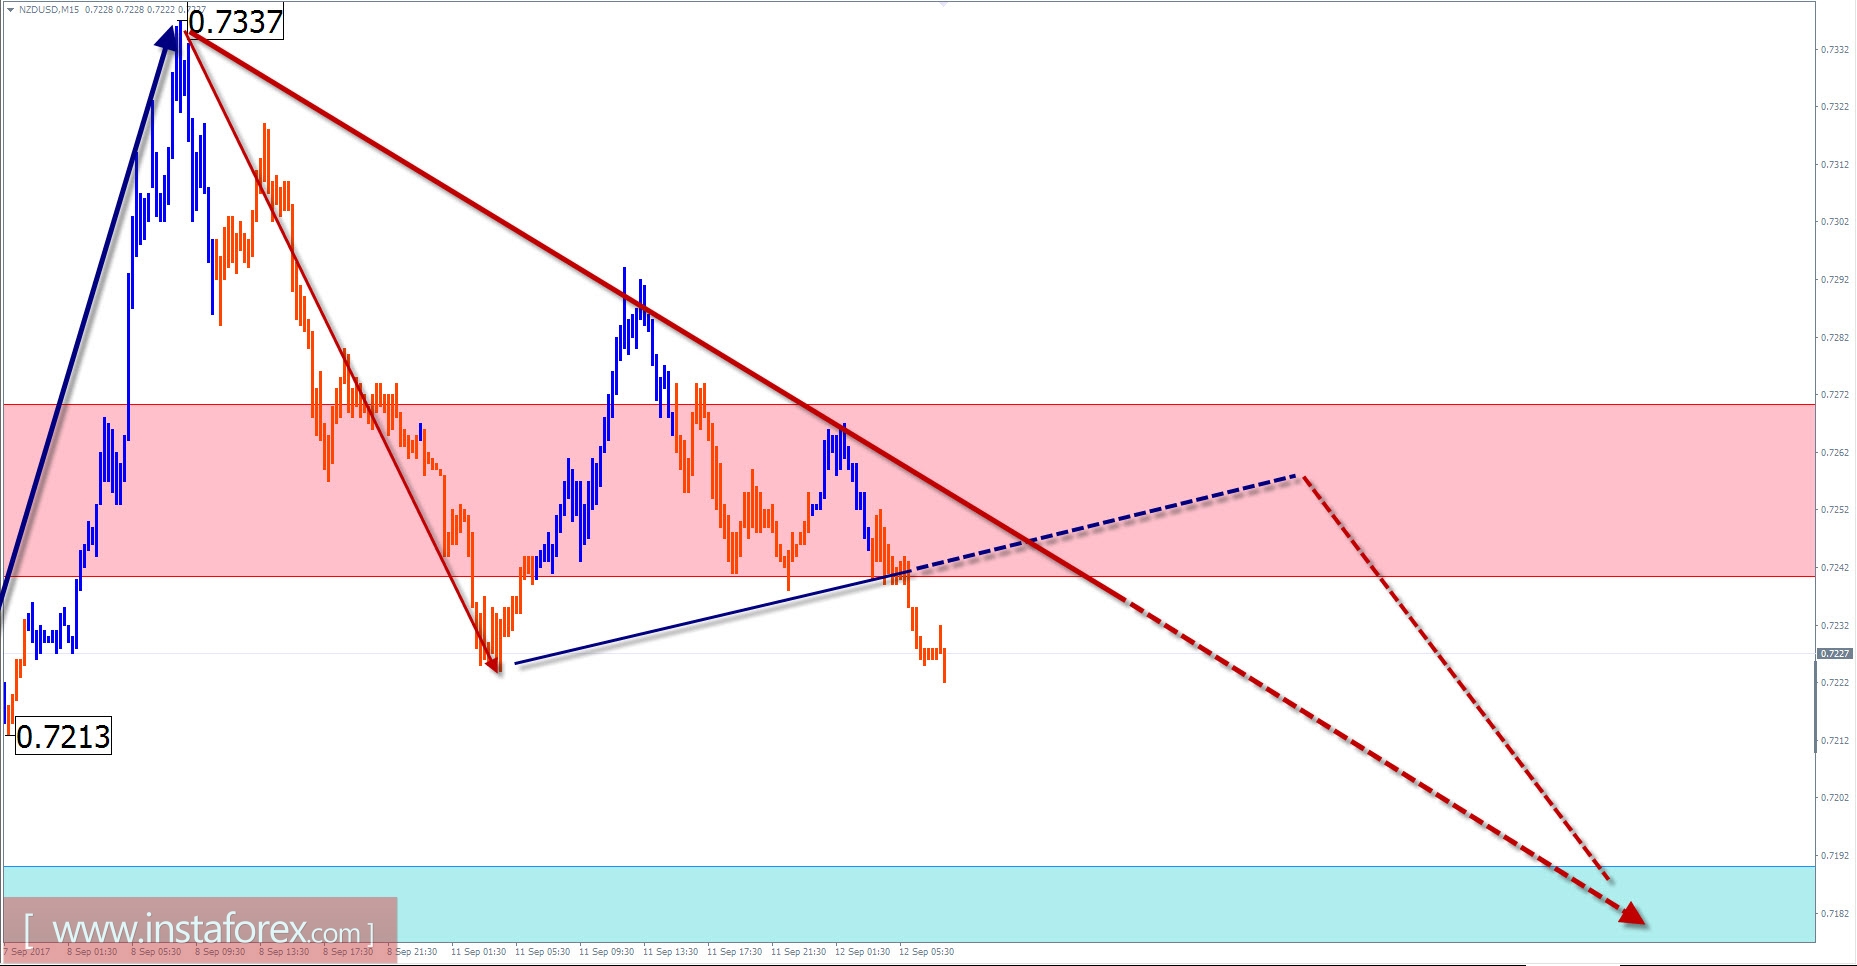
Explanations to the figures: For simplified wave analysis, a simple waveform is used that combines 3 parts namely A, B, and C. All types of correction are created and most of the impulses can be found in these waves. Every time frame is considered and the last incomplete wave is analyzed.
The zones marked on the graphs indicate the probability of a change in the direction of motion has significantly increased as calculated in the areas. Arrows indicate the wave counting following the technique used by the author. A solid background of the arrows signifies the structure has been formed while the dotted one means the expected wave motion.
Attention: The wave algorithm does not take into account the duration of the movement of tools in time. The forecast is not a trading signal! To conduct a bargain, you need to confirm the signals used by your trading systems.