 English
  Русский
 Bahasa Indonesia
 Bahasa Malay
 ไทย
ไทย Español
 Deutsch
 Български
 Français
 Tiếng Việt
 中文
中文 বাংলা
বাংলা हिन्दी
 Čeština
 Українська
 Română

EUR/USD
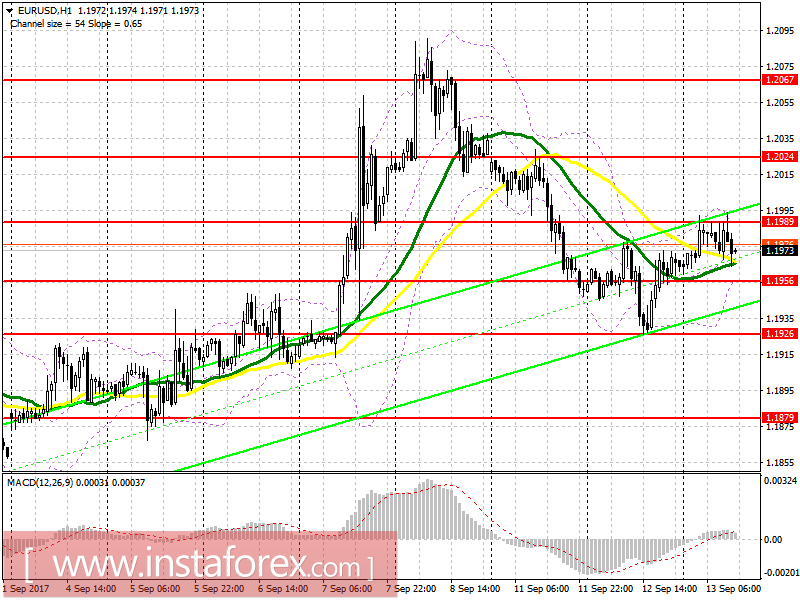
To open long positions for EURUSD, you need:
The buyers could not get a hold of 1.1989, which led to the selling of the euro in the morning. At the moment, it's best to return to long positions only after a real breakdown of 1.1989 happens. It is possible, on the weak data on inflation in the US. In this case, you can count on an update of 1.2024 and 1.2067, where I recommend locking in the profit. If the euro falls below 1.1956, it is best to return to long positions after updating 1.1956 or to rebound from 1.1879.
To open short positions for EURUSD, you need:
Sellers will try to drive the pair further below the level of 1.1956, and good data on the US will lead to the selling of the euro to the support area of 1.1926 and 1.1879, where I recommend locking in profits. In the event of a sharp increase in the euro in the afternoon, it would be best to pay attention to the selling of the euro for it to rebound from 1.2024.
GBP/USD
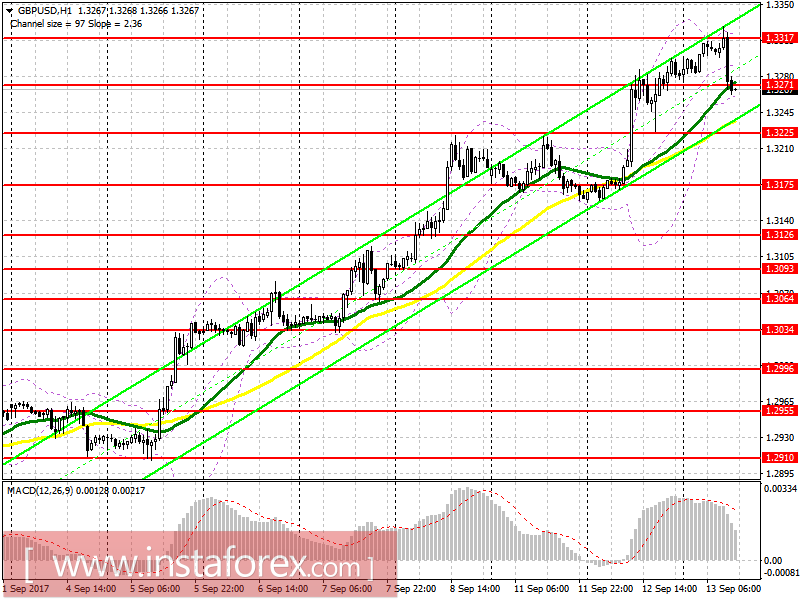
To open long positions for GBPUSD, you need:
Buyers were unable to get a hold of the level of 1.3317, which led to the selling of the British pound. At the moment, going back to buying would be done best only after upgrading a large support level of 1.3225 or a rebound from 1.3175.
To open short positions for GBPUSD, you need:
Selling of the pound fully coincided with my morning forecast. Currently, the consolidation is below the level of 1.3271, which may crash the British pound further to a support level of 1.3225 with a further exit at 1.3175, where I recommend locking in the profit. In the afternoon, selling of the pound can be seen from 1.3288 or on a rebound from 1.3340.
Indicator description
- Moving Average (average sliding) 50 days - yellow
- Moving Average (average sliding) 30 days - green
- MACD: fast EMA 12, slow EMA 26, SMA
- Bollinger Bands 20