 English
  Русский
 Bahasa Indonesia
 Bahasa Malay
 ไทย
ไทย Español
 Deutsch
 Български
 Français
 Tiếng Việt
 中文
中文 বাংলা
বাংলা हिन्दी
 Čeština
 Українська
 Română

GBP / JPY
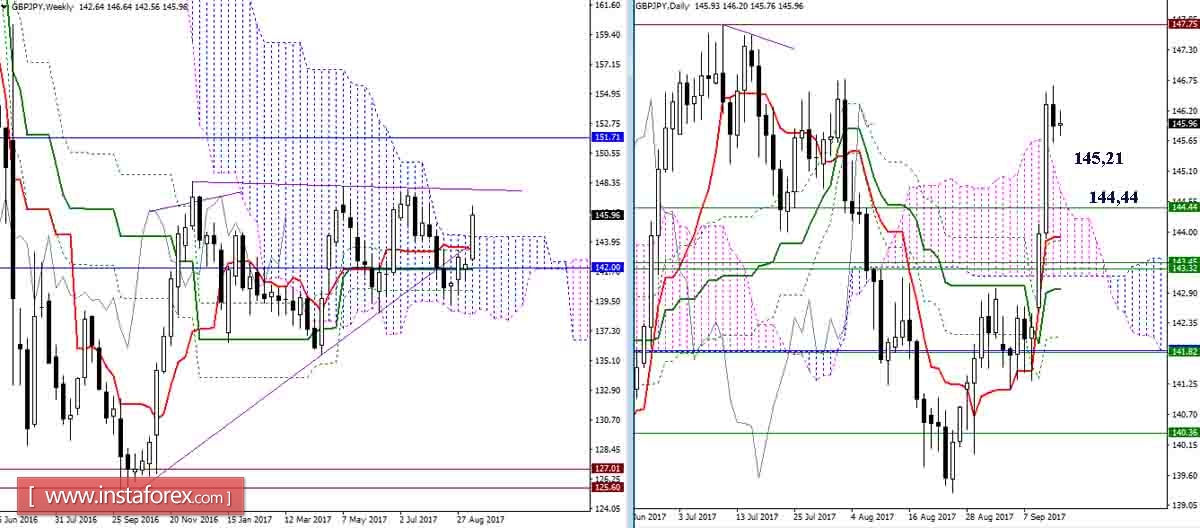
The steam appeared to slow down. The former resisted level now act as supports, the closest is the Ichimoku cloudy daytime 145.21 (Senkou Span A) and the week 144.44 (Senkou Span B). Gaining a foothold above the clouds will consider the emergence of new targets for the breakdown of clouds.
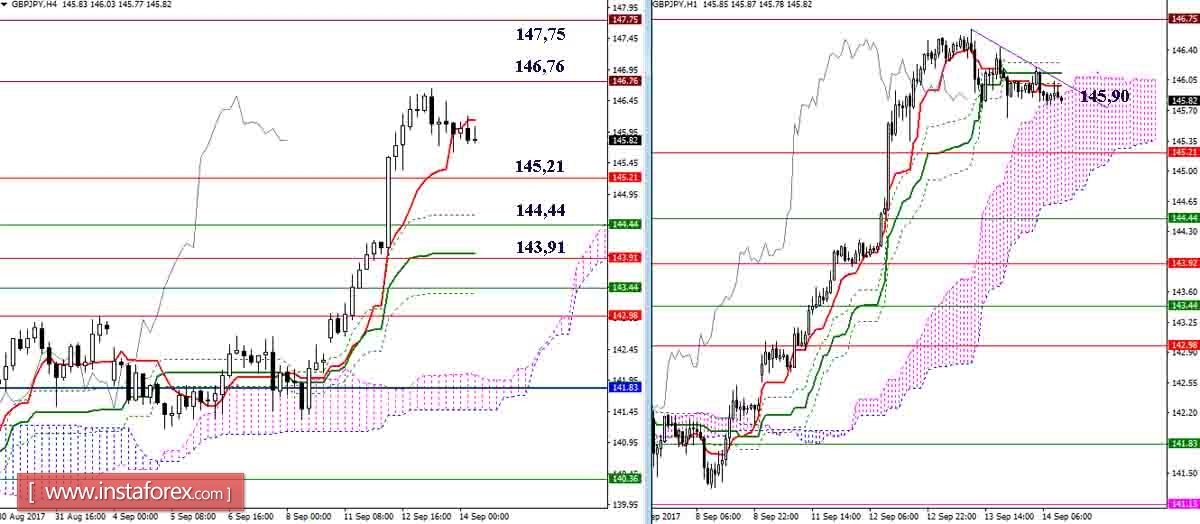
Having met the resistance zone of the daily maximum extreme at 146.75, the increasing players stopped and witnessed a corrective decline to the cloudiness region of H1. Restoring the trend and overcoming 146.75 will consider the possibility of an uptrend towards the weekly maximum extreme at 147.75. In case that the acquired cloud H1 seems reliable, we can expect a further decline. With this, the landmarks will be the lower boundary of the cloud H1, the line of the cross H4 and the support of the higher halves 145.21 - 144.44 - 143.91.
EUR / JPY
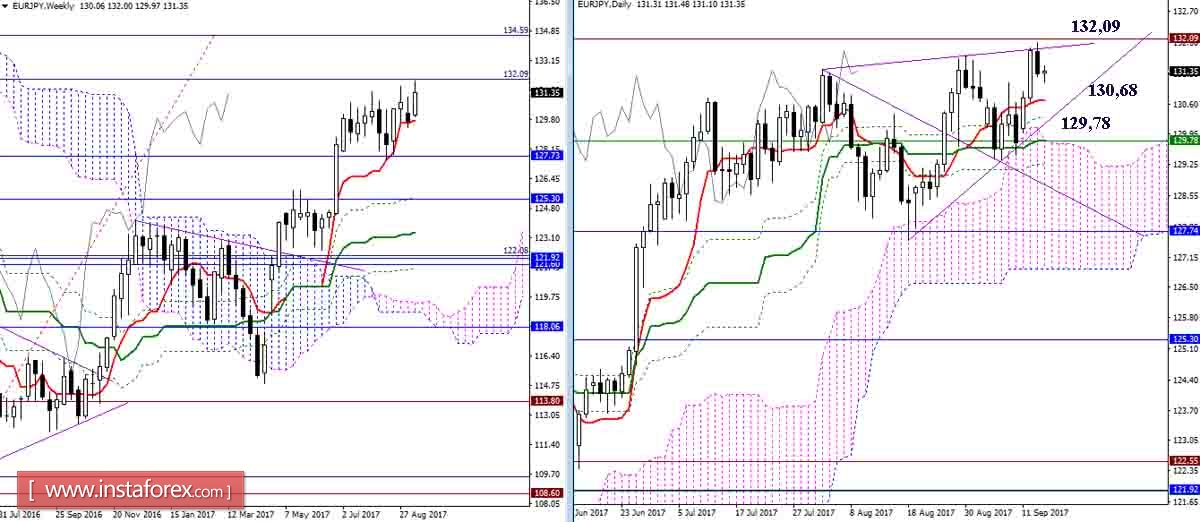
Another attempt to test the first target of the week at the breakdown of the cloud (132.09) has not yet given a positive result. Moreover, the extended braking and corrective reduction led to the potential development of the bearish Wolfe Wave. The daytime Tenkan (130.68) can be distinguished to be the nearest support, along with the unification of the weekly Tenkan with day-time Kijun and Senkou Span A (129.78).
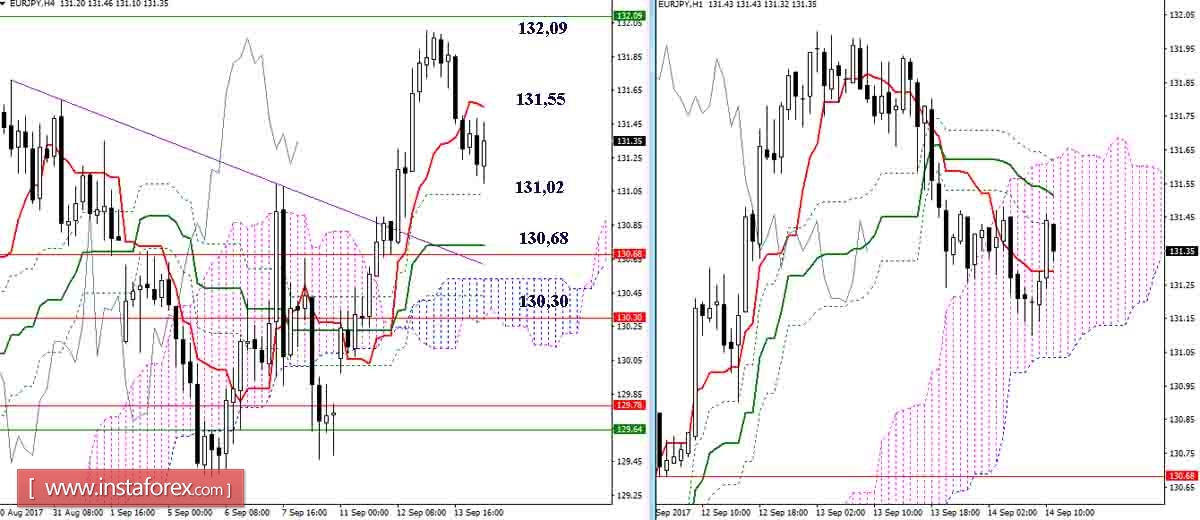
Lower timeframes mainly rebuilt to the side of players on the slide. The supports for today are the levels of 131.02 - 130.68 - 130.30. Holding a position below will form new downward targets and benchmarks. The players' reversal to the H4 Tenkan increased (131.55) and the exit to the bull zone through the H1 cloud will change the existing balance of forces. While a new assessment of the situation will be needed to identify the prospects.
Indicator parameters:
all time intervals 9 - 26 - 52
Color of indicator lines:
Tenkan (short-term trend) - red,
Kijun (medium-term trend) - green,
Fibo Kijun is a green dotted line,
Chinkou is gray,
Clouds: Senkou Span B (SSB, long-term trend) - blue,
Senkou Span A (SSA) - pink.
Color of additional lines:
Support and resistance MN - blue, W1 - green, D1 - red, H4 - pink, H1 - gray,
Horizontal levels (not Ichimoku) - brown,
Trend lines - purple.