 English
  Русский
 Bahasa Indonesia
 Bahasa Malay
 ไทย
ไทย Español
 Deutsch
 Български
 Français
 Tiếng Việt
 中文
中文 বাংলা
বাংলা हिन्दी
 Čeština
 Українська
 Română

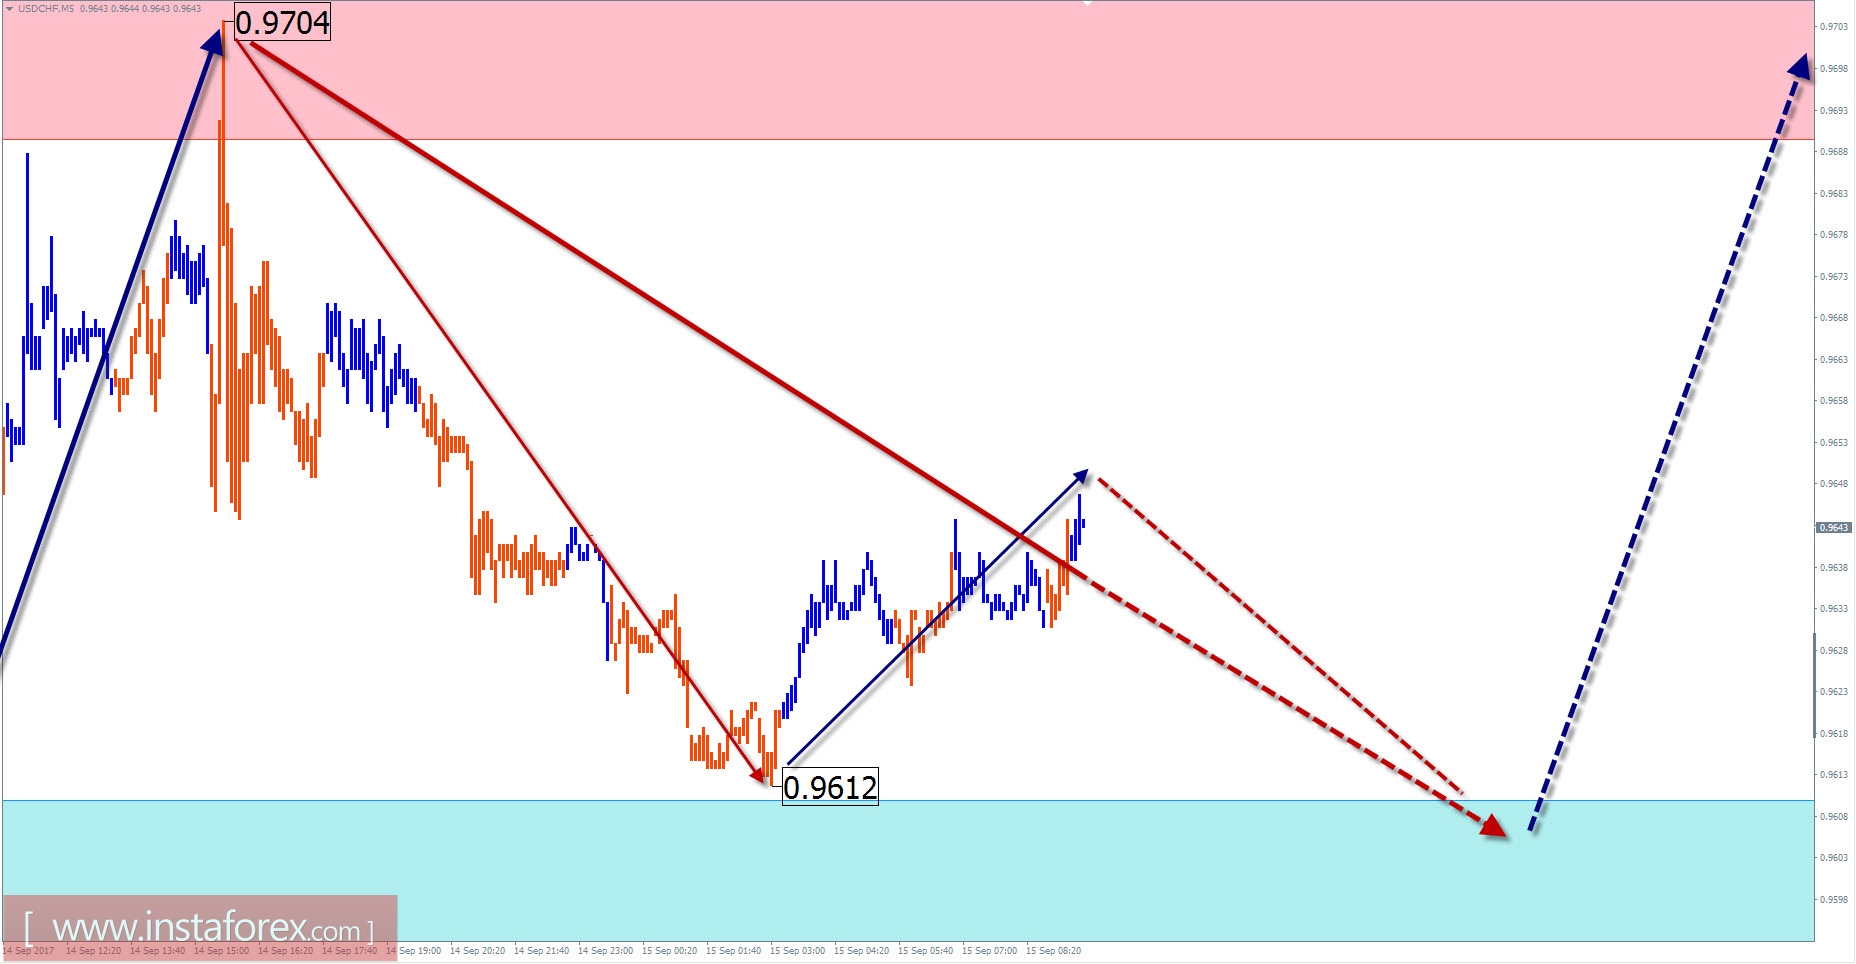
USD / CHF review with current day forecast
As shown on the chart, the short-term direction of the major currency Swiss franc is set by a bearish wave which started at the end of last year. The potential to decline by the end was not achieved. Preliminary calculations allow the trajectory of the price to assume at least 4 price figures down from the current values.
The current trend in the horizontal channel forms a counter correction since the beginning of summer. The last unfinished plot of August 29 looks like an expanded flat. The analysis of the structure opens the possibility of an increase in the quotation towards the preliminary target zone in the area of two price figures.
In the next session for today, the flat movement is more likely with a common descending vector. The completion of the correction and the change of direction are expected at the end of the day. The rise of quotations can be relative to the output of the news block and will be accompanied by a sharp increase in the volatility of the instrument.
Boundaries of resistance zones:
- 0.9690 / 0.9720
Boundaries of support zones:
- 0.9610 / 0.9580
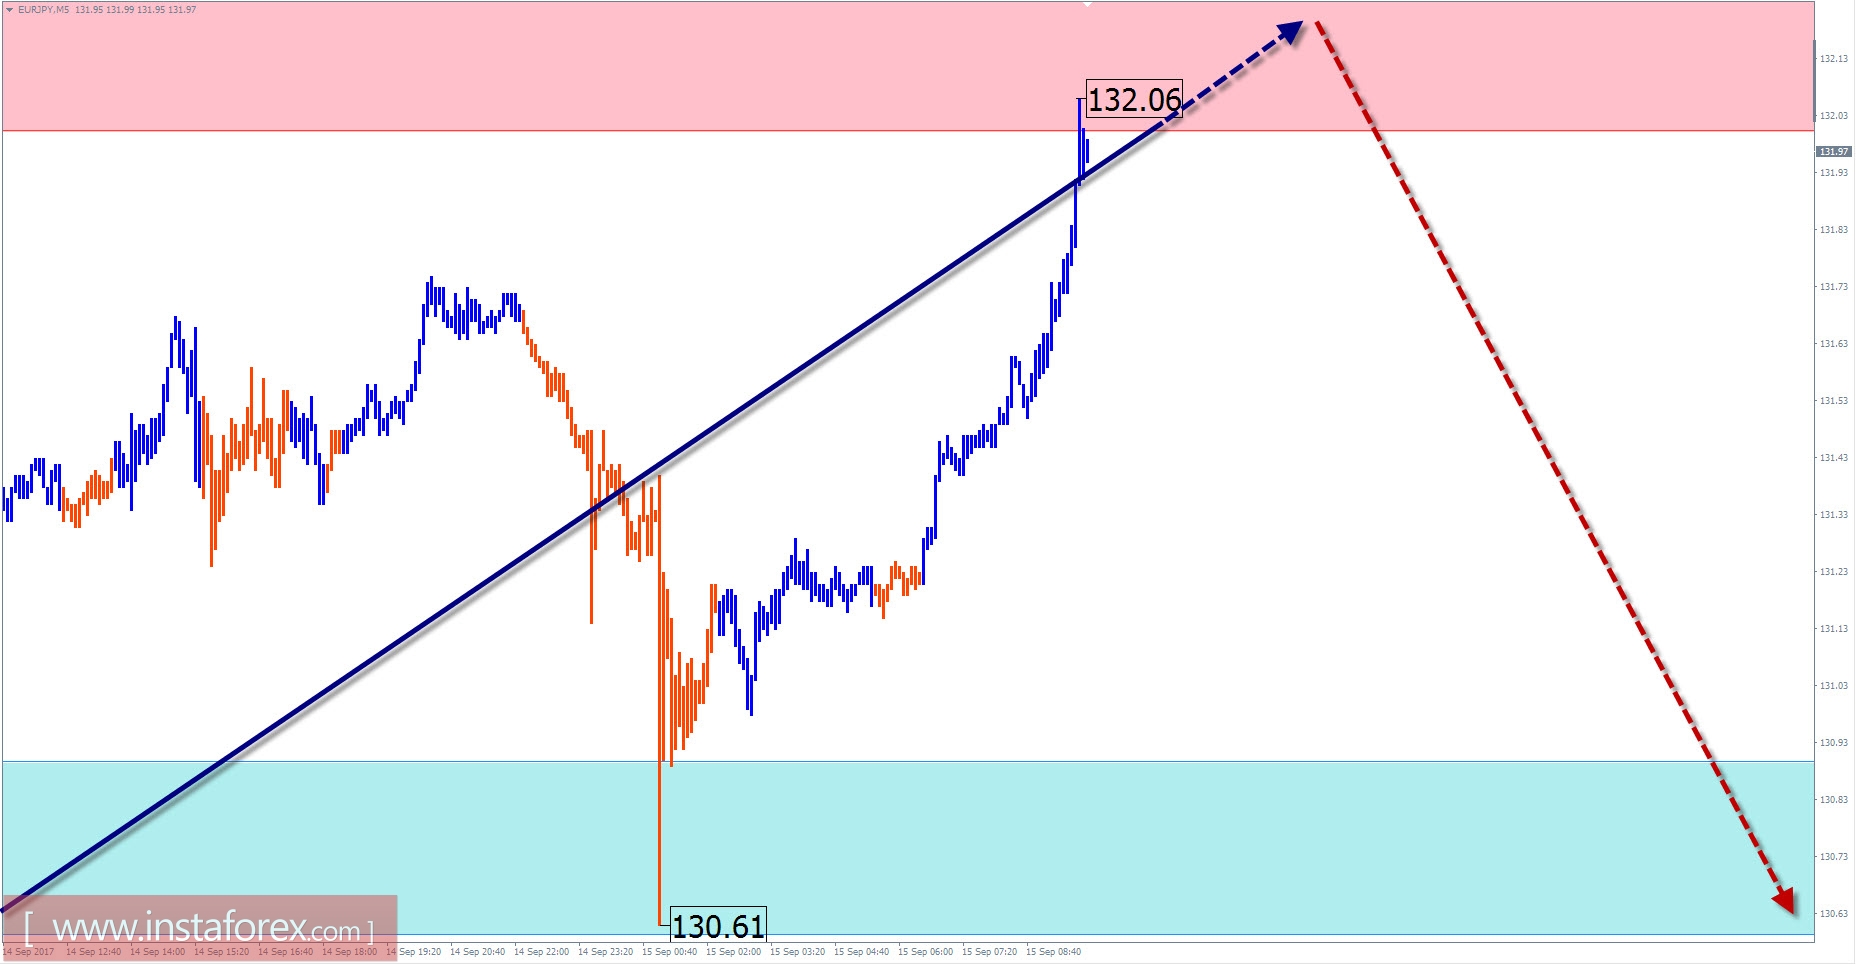
EUR / JPY outlook with current day forecast
Since June last year, the direction of the short-term trend on the EUR/JPY cross currency chart continues to set the wave of the bullish trend. The price settled above the control section after a breakout on a strong level with a potential for a reversal in late June. Barriers of the price formed a flat movement in the form of an expanding triangle. The analysis of the wave structure of this section indicates that the correction has been completed.
Quotations of the pair are currently within the boundaries of the next zone, which can become the turning point of another change in direction.
During the nearest trading session, the upward movement of the price is expected to end and a reversal will be formed within the settlement range of the resistance zone. A short-term breakout in the upper boundary of the zone cannot be ruled out. The pair is in the disposition to begin a downward trend with the current momentum.
Boundaries of resistance zones:
- 132.00 / 132.30
Boundaries of support zones:
- 130.90 / 60
Explanations to the figures: For simplified wave analysis, a simple waveform is used that combines 3 parts namely A, B, and C. All types of correction are created and most of the impulses can be found in these waves. Every time frame is considered and the last incomplete wave is analyzed.
The zones marked on the graphs indicate the probability of a change in the direction of motion has significantly increased as calculated in the areas. Arrows indicate the wave counting following the technique used by the author. A solid background of the arrows signifies the structure has been formed while the dotted one means the expected wave motion.
Attention: The wave algorithm does not take into account the duration of the movement of tools in time. The forecast is not a trading signal! To conduct a bargain, you need to confirm the signals used by your trading systems.