 English
  Русский
 Bahasa Indonesia
 Bahasa Malay
 ไทย
ไทย Español
 Deutsch
 Български
 Français
 Tiếng Việt
 中文
中文 বাংলা
বাংলা हिन्दी
 Čeština
 Українська
 Română

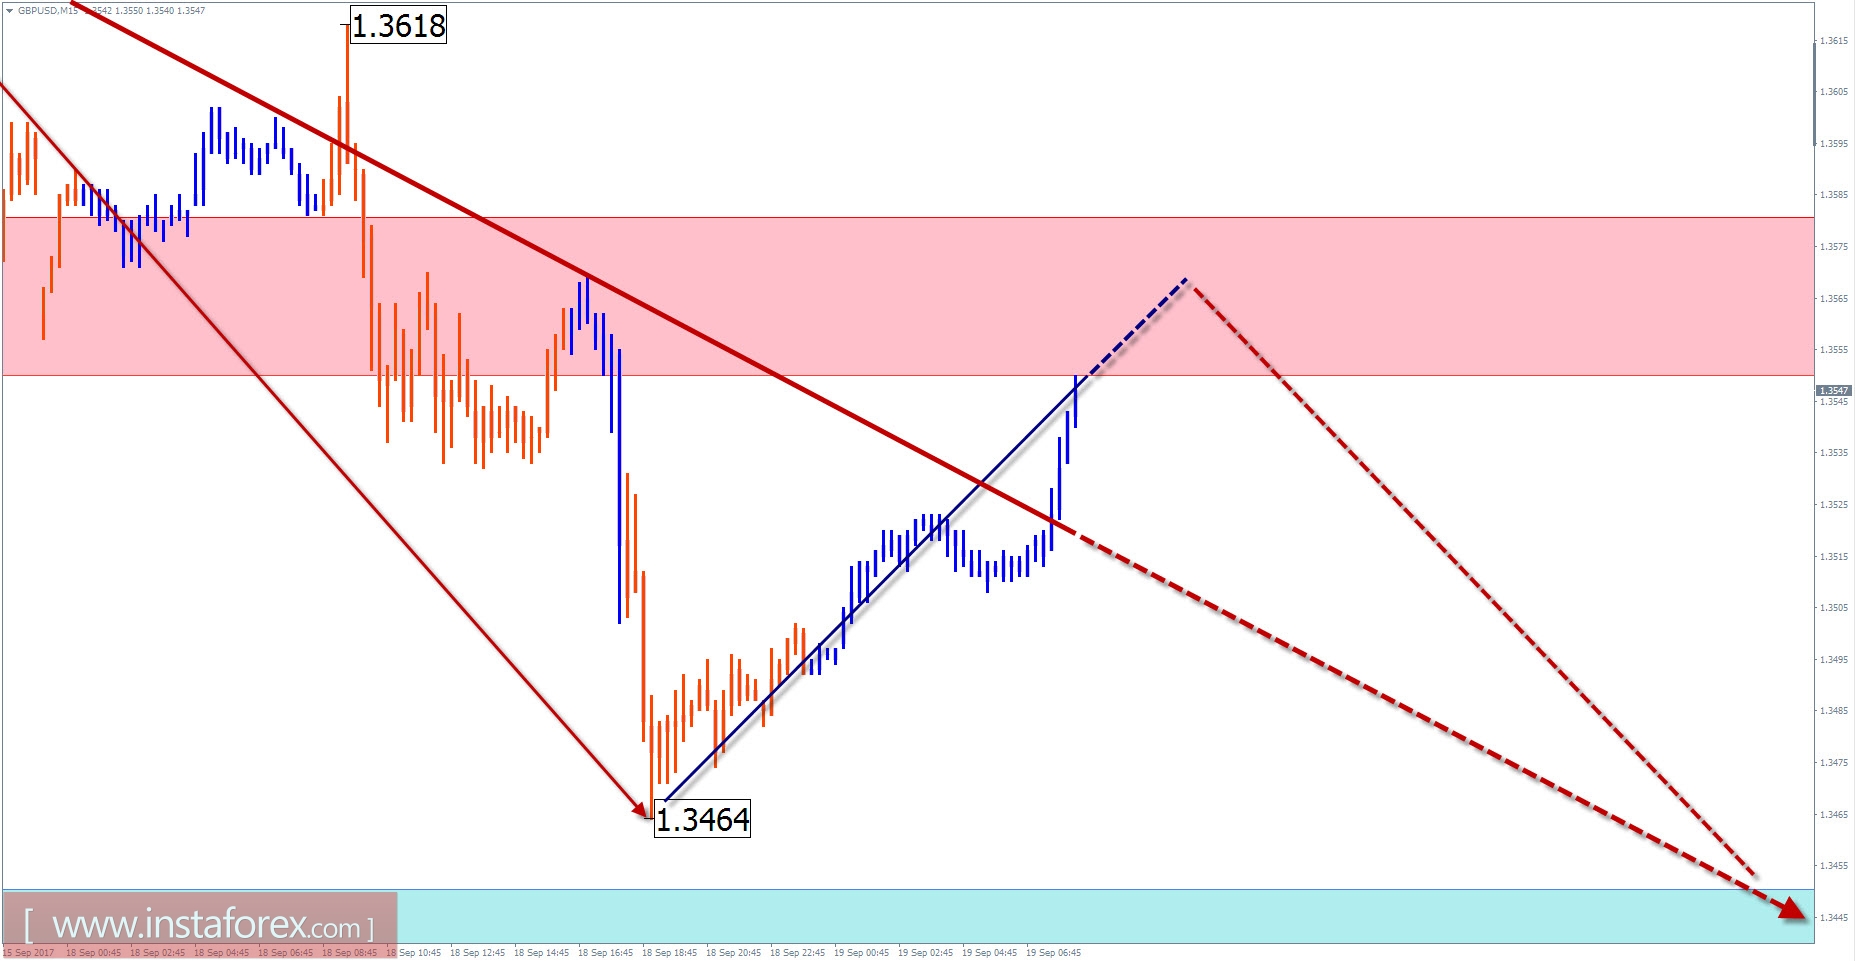
Overview of GBP / USD pair with a forecast for the current day
The major pair of British currency continues to be adjusted after a prolonged decline. Calculation of the target area indicates the proximity of its lower boundary from the current values of the pair. Correction of the wave analysis of the section shows the completeness of the structure which is close to the optimal proportions of the pattern.
Since Friday last week, the decline demonstrates a higher wave potential than necessary for a rollback. There's a high probability that this will be the first part of the reversal structure preceding the change of the short-term trend.
Today, a common flat tone is expected. The current ascending rate will shift into a downtrend and reach the estimated levels of support. A breakout in the lower boundary of this area is unlikely to happen for today.
Boundaries of resistance zones:
- 1.3550 / 80
Boundaries of support zones:
- 1.3450 / 20
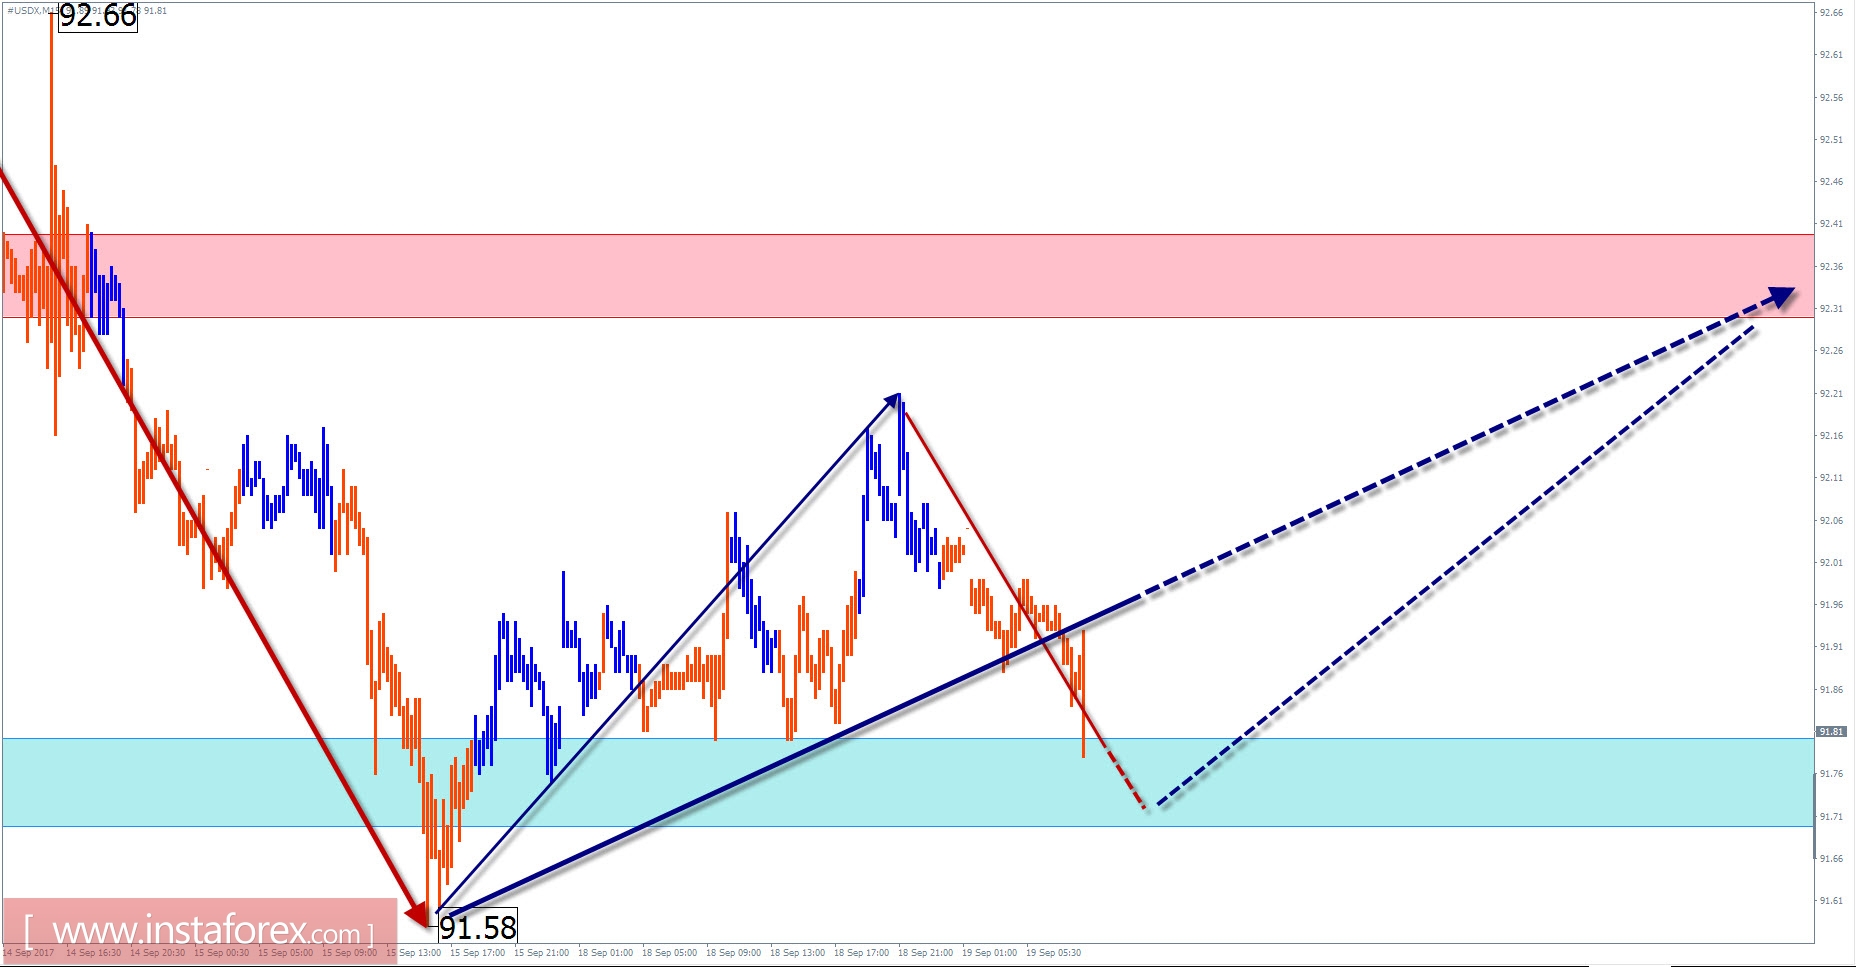
Overview of #USDX (US dollar index) with a forecast for the current day
The movement of the U.S. dollar index in the last 2 years was set by the algorithm of the emerging descending expanded flat. There is potential in a certain support area achieved by the quotations but it will not be able to hold down the tool for a long time.
Tracking the correction on the chart since the end of September, it shows that its purpose is to increase the wave level of the current trend wave before further upswing. Parts of this wave on the current day have already reached the minimum required proportions. The descending section of the movement from September 14 gave rise to a new zigzag wave of small scale. A change in direction can occur in the coming days.
The uptrend ascending area will most likely further move up today. A turn may occur at the nearest session within the support zone. A short-term breakout in the lower limit is not ruled out.
Boundaries of resistance zones:
- 92.30 / 40
Boundaries of support zones:
- 91.80 / 70
Explanations to the figures: For simplified wave analysis, a simple waveform is used that combines 3 parts namely A, B, and C. All types of correction are created and most of the impulses can be found in these waves. Every time frame is considered and the last incomplete wave is analyzed.
The areas marked on the graphs indicate the probability of a change in the direction of motion has significantly increased as calculated in the areas. Arrows indicate the wave counting following the technique used by the author. A solid background of the arrows signifying the structure has been formed while the dotted one means the expected wave motion.
Attention: The wave algorithm does not take into account the duration of the movement of tools in time. The forecast is not a trading signal! To conduct a bargain, you need to confirm the signals used by your trading systems.