 English
  Русский
 Bahasa Indonesia
 Bahasa Malay
 ไทย
ไทย Español
 Deutsch
 Български
 Français
 Tiếng Việt
 中文
中文 বাংলা
বাংলা हिन्दी
 Čeština
 Українська
 Română

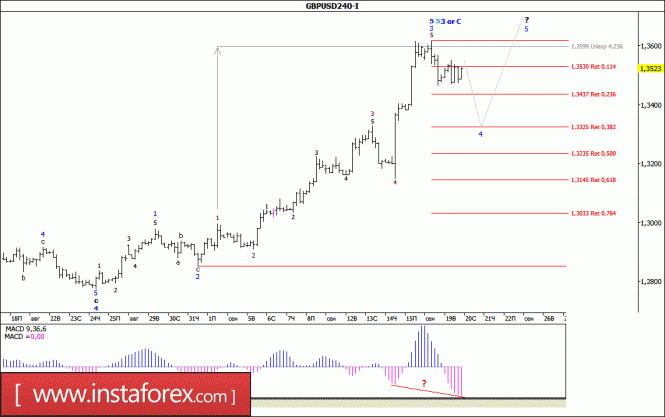
Analysis of wave counting:
During the past day, the GBP / USD pair held within a fairly narrow price range, trading around the level of the 35th figure before the close of the American session. At the same time, it can be assumed that the currency pair remained in the formation stage which was designated on the eve of the 4th wave, 5th, 5th, 3rd (or C). If this is the case, then before resuming the growth of quotations, the currency pair will nevertheless continue its decline at least to the level of 1.3325.
The objectives for building the downward wave:
1.3437 - 23.6% of Fibonacci
1.3325 - 38.2% of Fibonacci
Aims to build the upward wave:
1.3599 - 423.6% of Fibonacci
1.3700
General conclusions and trading recommendations:
Wave counting has suffered some changes in connection with the breakdown of the mark of 1.3270. The increase in quotations may resume with targets near the estimated level of 1.3599, which corresponds to 423.6% of Fibonacci and above about 37 figures, within wave 5, 5, 5, 3 (or C). Within the limits of the correction wave 4, the decline began with the targets near the marks of 1.3437 and 1.3325, which corresponds to 23.6% and 38.2% Fibonacci. The MACD divergence warns about the readiness of the tool to build a new impulse wave.