 English
  Русский
 Bahasa Indonesia
 Bahasa Malay
 ไทย
ไทย Español
 Deutsch
 Български
 Français
 Tiếng Việt
 中文
中文 বাংলা
বাংলা हिन्दी
 Čeština
 Українська
 Română

Further Development
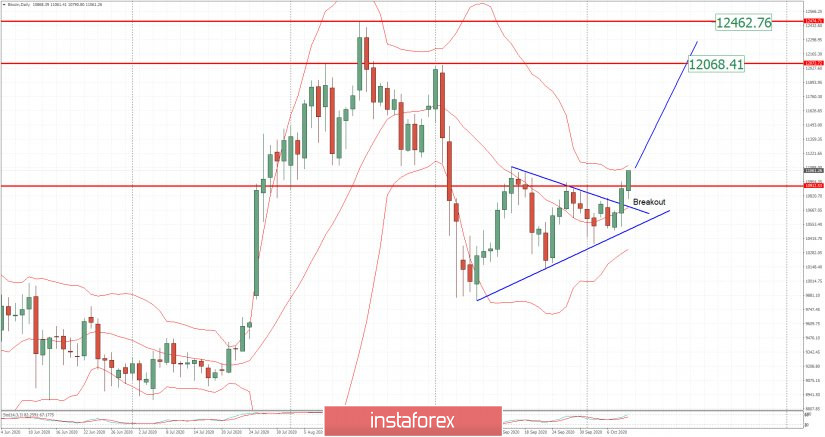
Analyzing the current trading chart of BTC, I found that there is the breakout of the symmetrical triangle and perfect contraction, which is strong sign for the further upside movement.
My advice is to watch for buying opportunities on the dips with the upside targets at $12,068 and $12,450
Key Levels:
Resistance: $11,090
Support level: $10,500