 English
  Русский
 Bahasa Indonesia
 Bahasa Malay
 ไทย
ไทย Español
 Deutsch
 Български
 Français
 Tiếng Việt
 中文
中文 বাংলা
বাংলা हिन्दी
 Čeština
 Українська
 Română

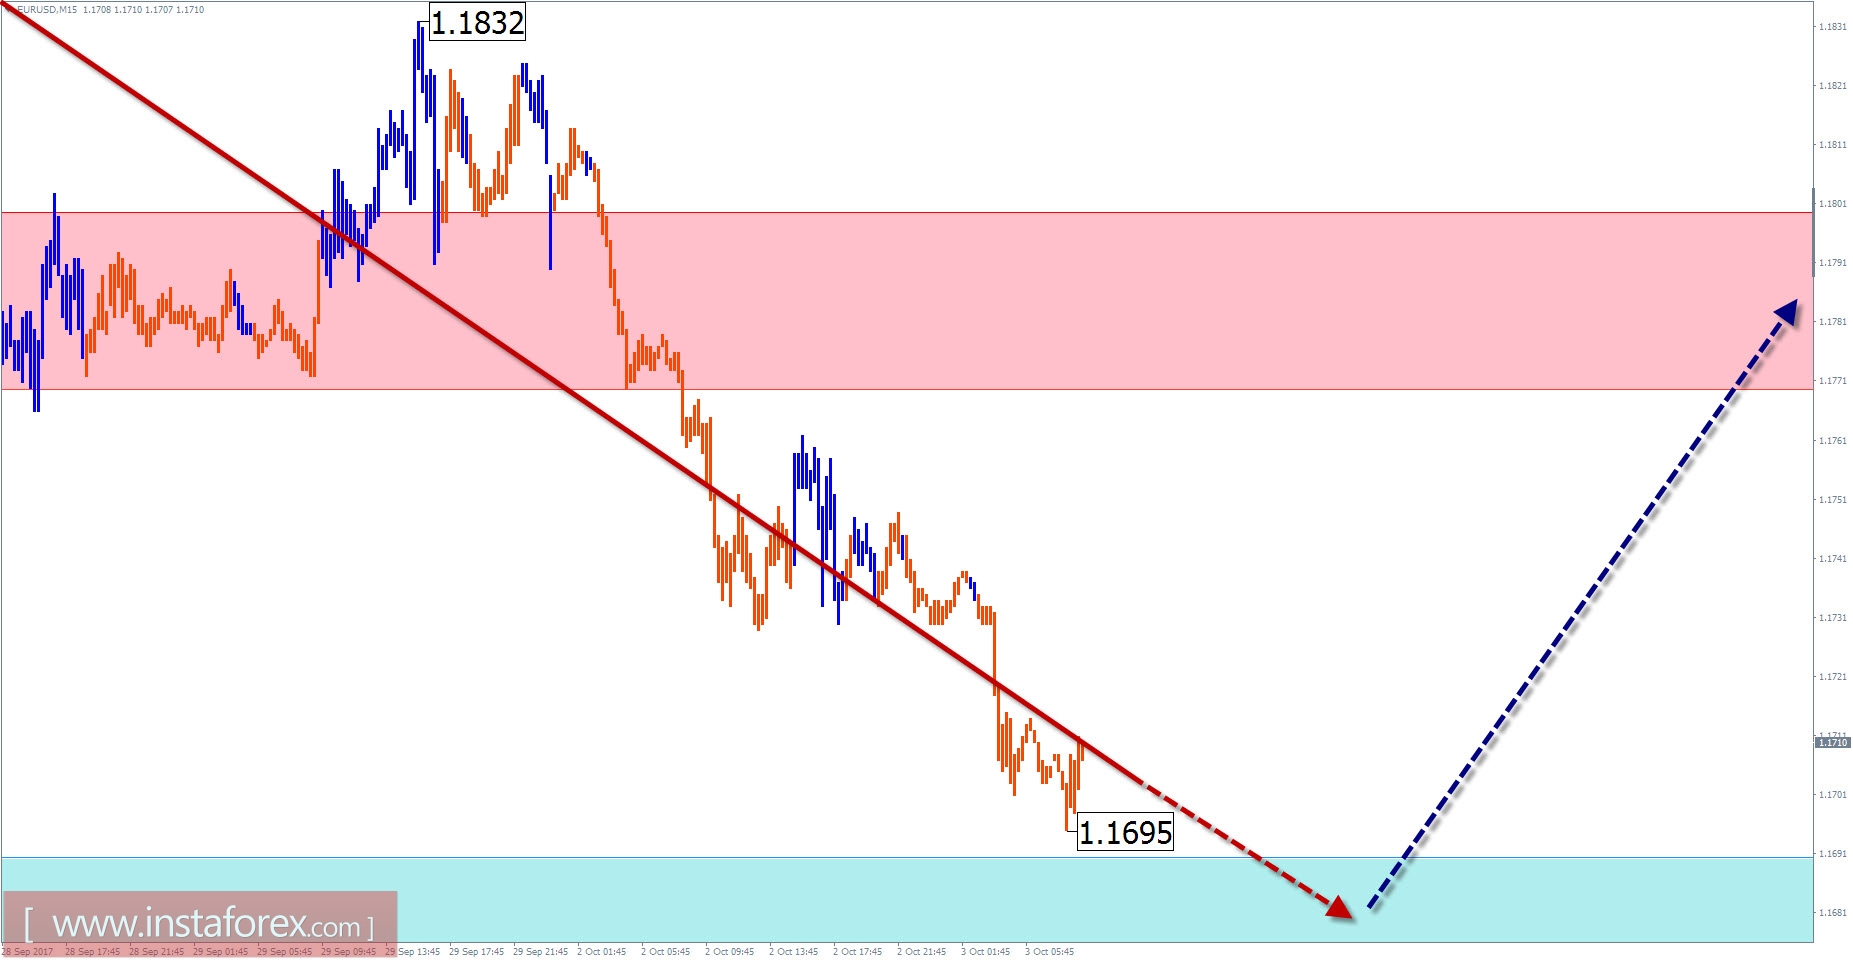
Overview of EUR / USD with a forecast for the current day
The movement of the major European currency chart since March 2015 fits into the algorithm of forming the correctional figure "stretched plane". The final part of the wave started from December last year. To date, the quotes of the pair have reached the calculated level of elongation, while the structure of the whole wave does not show completeness.
Over the past month, the chart has developed a downward wave. The potential for downward movement is close to exhaustion. The wave level of this wave is not enough to form a trend reversal. Next, you should expect a new turn in the main direction of traffic.
The change in the rate can occur already in the next trading sessions. The rising phase of the movement is more likely in the afternoon.
The boundaries of the resistance zones:
- 1.1770 / 1.1800
The boundaries of the support zones:
- 1.1690 / 60
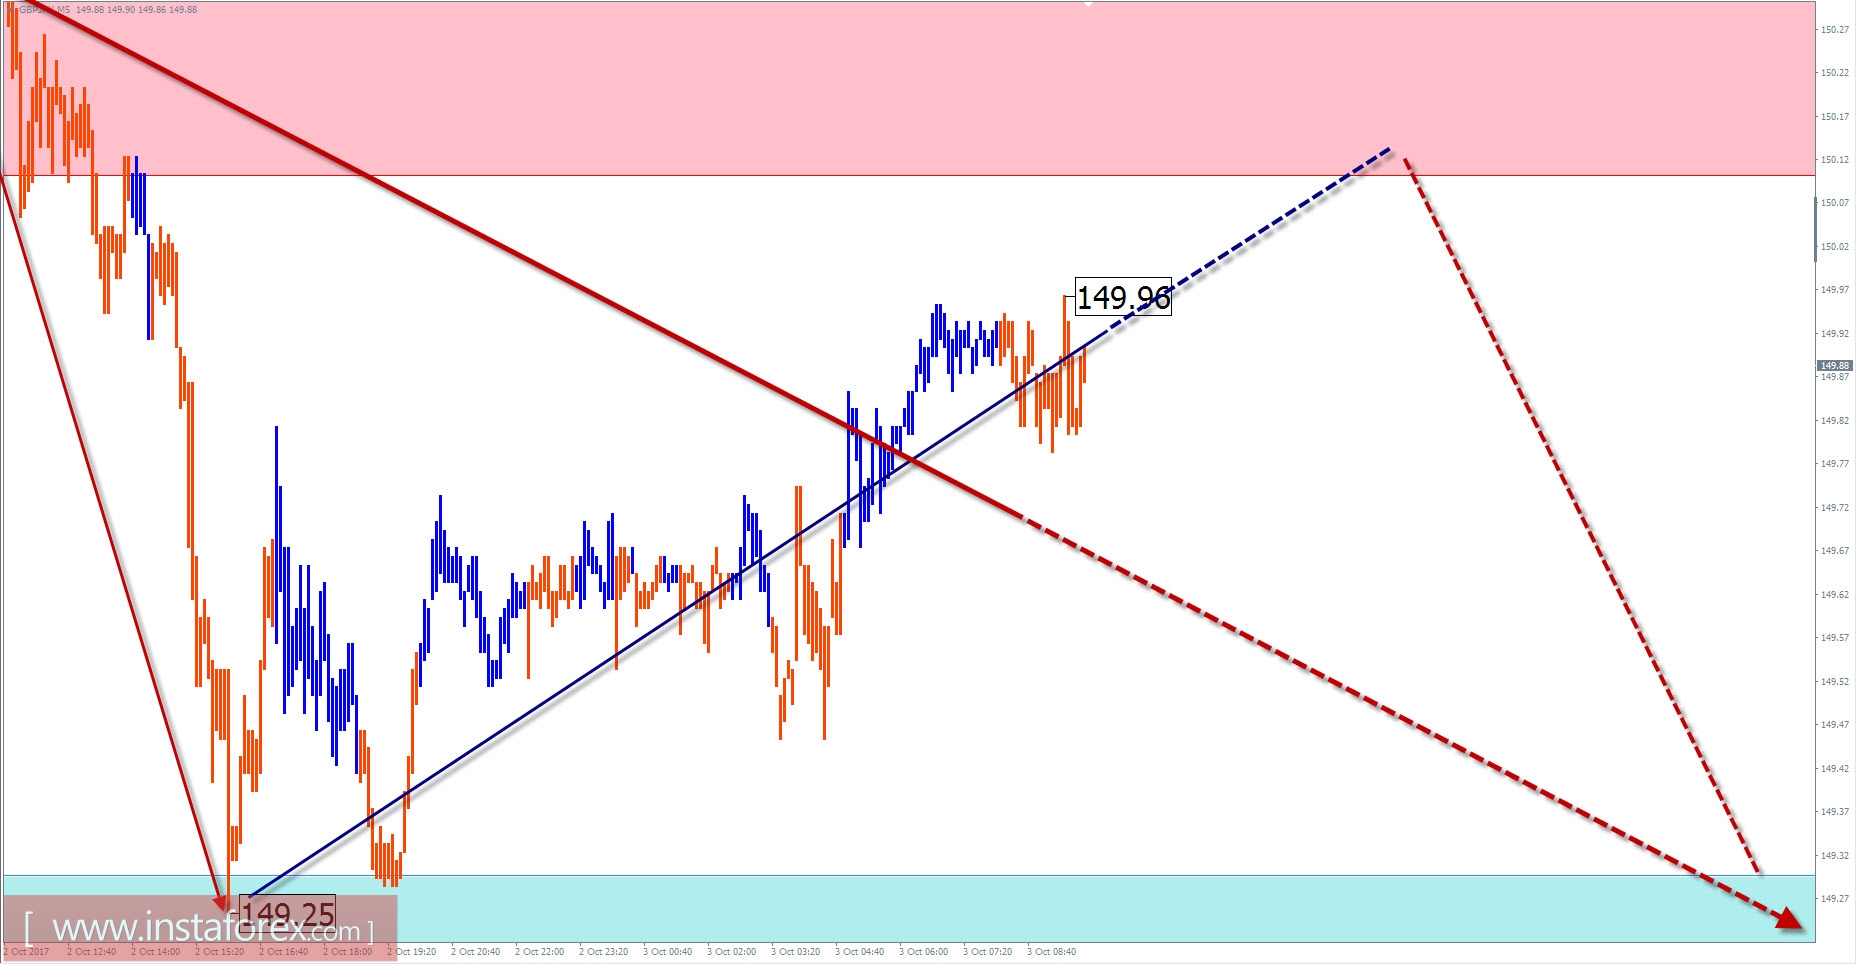
GBP / JPY outlook for the current day's forecast
The price of the cross pound sterling / yen pair as a result of the annual growth of the exchange rate has reached the lower limit of the wide potential reversal zone of the chart. The inertia and scale of the movement are large enough for a rapid trend change but the upside potential is limited. To continue the current trend, the pair needs to form at least the correction of the last segment of the trend.
The high wave level of the beginning of the descending section of the chart in September suggests the formation of the first part of the reversal zigzag. In the last two weeks, the middle part of the wave formed in the flat, in which the final fragment is missing for today.
In the next trading sessions, the probability of a common flute attitude remains. Its borders are the nearest meeting zones. The change in the vector of fluctuations in the price of the descending rate can be expected closer to the end of the day.
The boundaries of the resistance zones:
- 150.10 / 40
The boundaries of the support zones:
- 149.30 / 149.00
Explanations to the figures: For simplified wave analysis, a simple waveform is used that combines 3 parts (A; B; C). Of these waves, all kinds of correction are composed and most of the impulses. On each considered time frame the last, incomplete wave is analyzed.
The areas marked on the graphs are indicated by the calculation areas in which the probability of a change in the direction of motion is significantly increased. Arrows indicate the wave counting according to the technique used by the author. The solid background of the arrows indicates the structure formed, the dotted one indicates the expected wave motion.
Attention: The wave algorithm does not take into account the duration of the tool movements in time. The forecast is not a trading signal! To conduct a trade transaction, you need to confirm the signals of your trading systems.