 English
  Русский
 Bahasa Indonesia
 Bahasa Malay
 ไทย
ไทย Español
 Deutsch
 Български
 Français
 Tiếng Việt
 中文
中文 বাংলা
বাংলা हिन्दी
 Čeština
 Українська
 Română

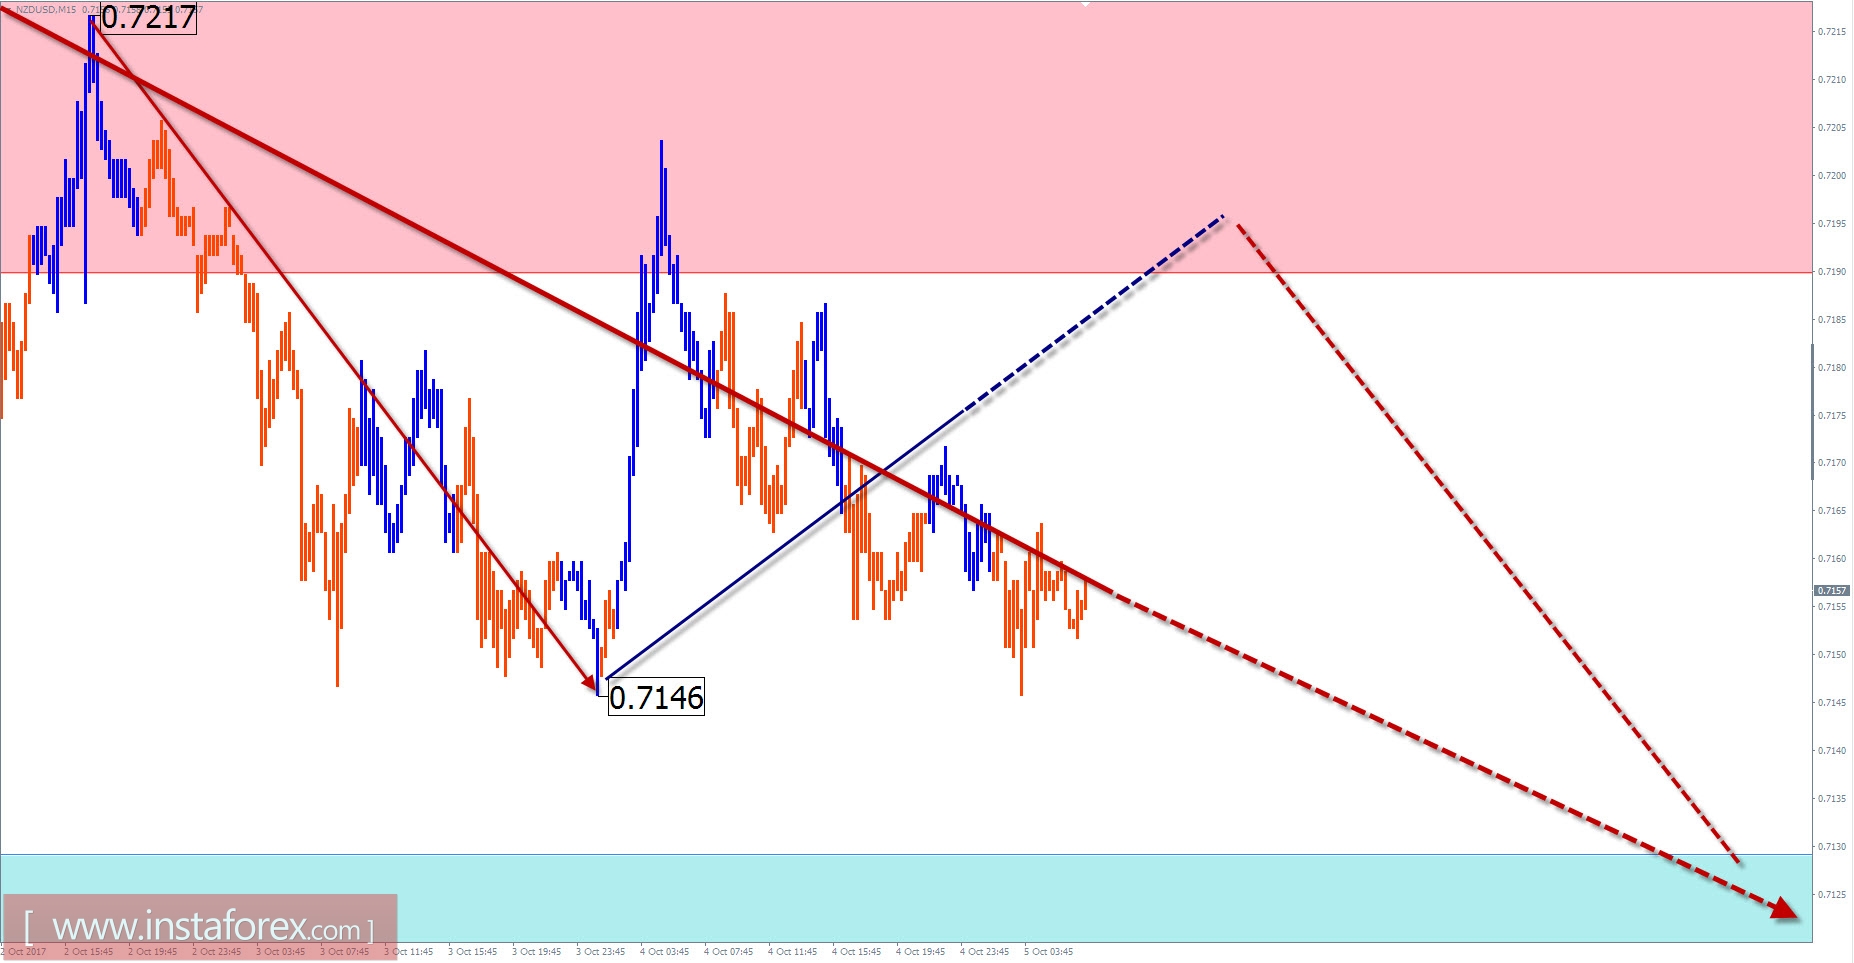
Overview of NZD / USD with the forecast for the current day
The trend direction of the price movement of the New Zealand dollar is set by the descending wave of July 27. On the chart, you can trace a distinct wave zigzag. The final part of the wave started 2 weeks ago and is still in the process of development. The preliminary calculation of the target zone shows about the figure to its upper limit from the current rate.
Before the final jerk down of the price, you need to complete a counter-rollback. It develops on the wrong trajectory, having a flute character.
In the morning, today the price is waiting for a limited growth with the prospect of achieving a resistance zone. Towards the end of the day, the probability of a change in the direction of the intersessional trend will increase and the pair will move down. The last phase has a high chance to move on the next day.
The boundaries of the resistance zones:
- 0.7190 / 0.7220
The support zone boundaries:
- 0.7130 / 0.7100
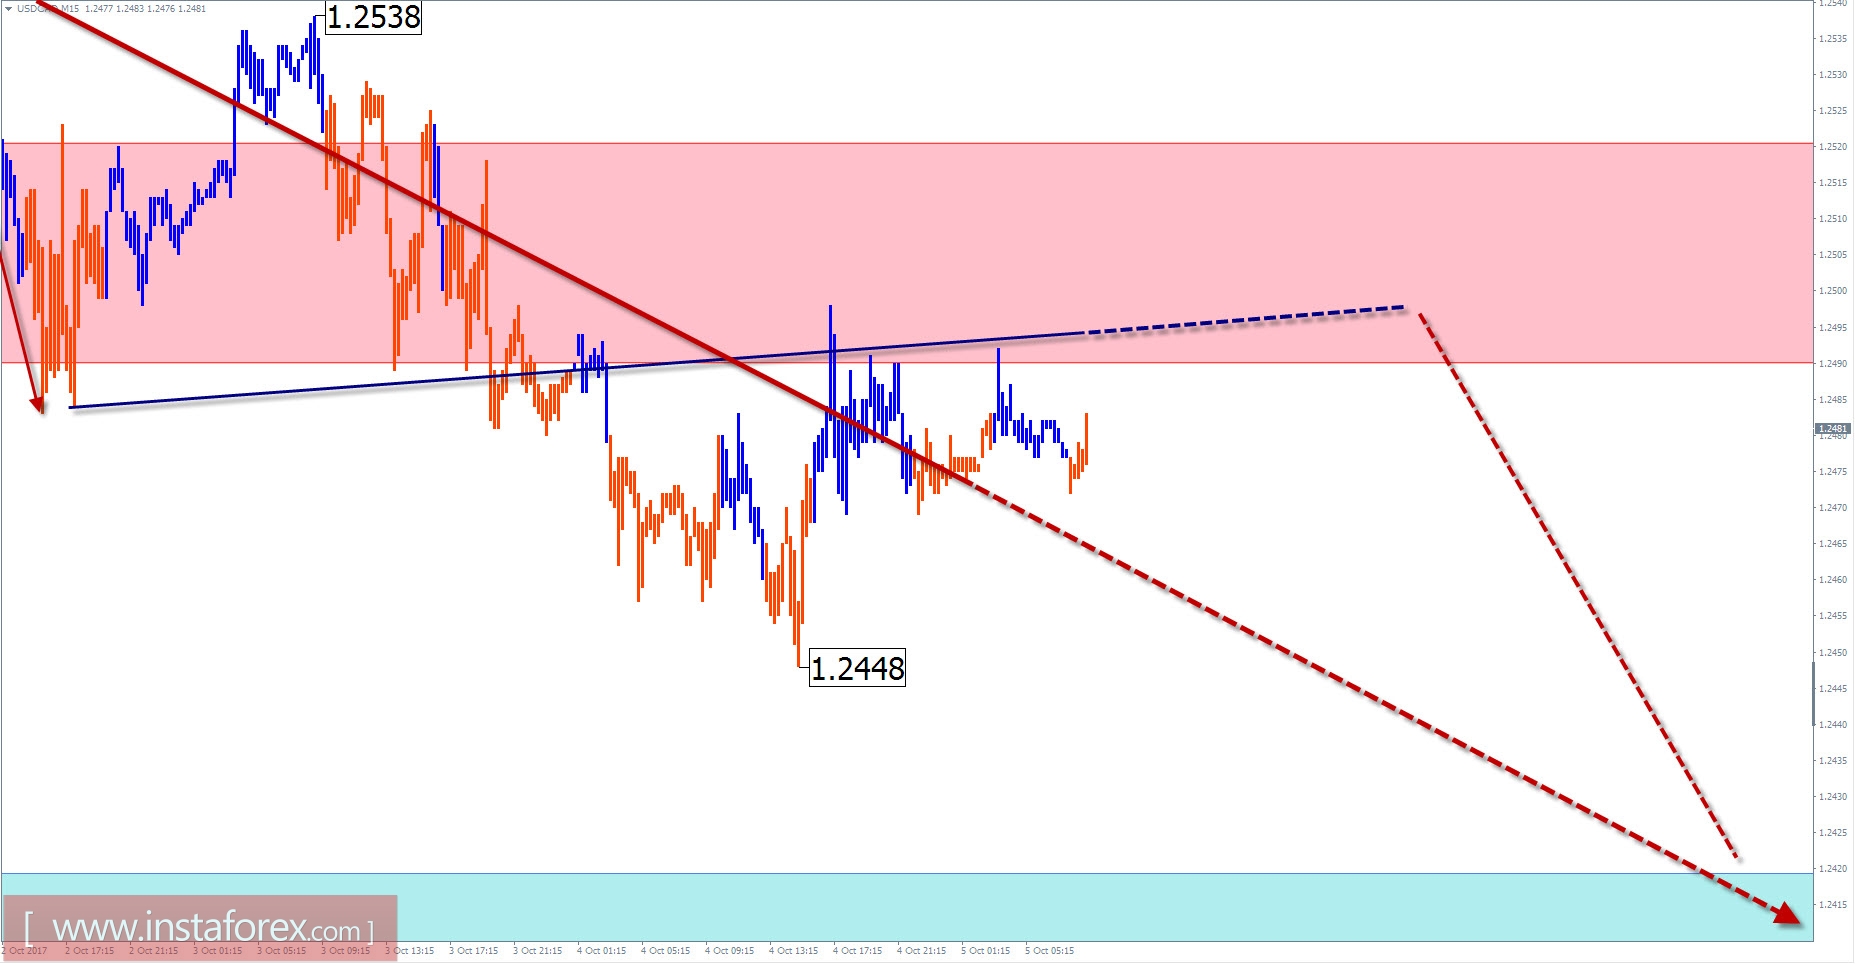
Overview of USD / CAD with the forecast for the current day
The graph of the main pair of the Canadian dollar during the last month shows a stable growth in the pair's price. This plot completed the current trend wave from May 5 and began an upward wave of at least a similar scale. At the end of last month, the pair's quotes reached the boundaries of the potential reversal zone. The analysis of the structure of the current movement indicates a high probability of forming a correction. Taking into account the impulsive character of the main wave trend, the correcting section can be realized in the form of a flat.
The most likely scenario for the current day is the descending mood of the pair's movement, with the flute nature of price fluctuations. The next session does not exclude a short-term recovery.
The boundaries of the resistance zones:
- 1.2490 / 1.2520
The support zone boundaries:
- 1.2420 / 1.2390
Explanations to the figures: For simplified wave analysis, a simple waveform is used that combines 3 parts (A; B; C). Of these waves, all kinds of correction are composed and most of the impulses. On each considered time frame the last, incomplete wave is analyzed.
The areas marked on the graphs are indicated by the calculation areas in which the probability of a change in the direction of motion is significantly increased. Arrows indicate the wave counting according to the technique used by the author. The solid background of the arrows indicates the structure formed, the dotted line indicates the expected wave motion.
Attention: The wave algorithm does not take into account the duration of the tool movements in time. The forecast is not a trading signal! To conduct a trade transaction, you need to confirm the signals of your trading systems.