 English
  Русский
 Bahasa Indonesia
 Bahasa Malay
 ไทย
ไทย Español
 Deutsch
 Български
 Français
 Tiếng Việt
 中文
中文 বাংলা
বাংলা हिन्दी
 Čeština
 Українська
 Română

GBP / JPY pair
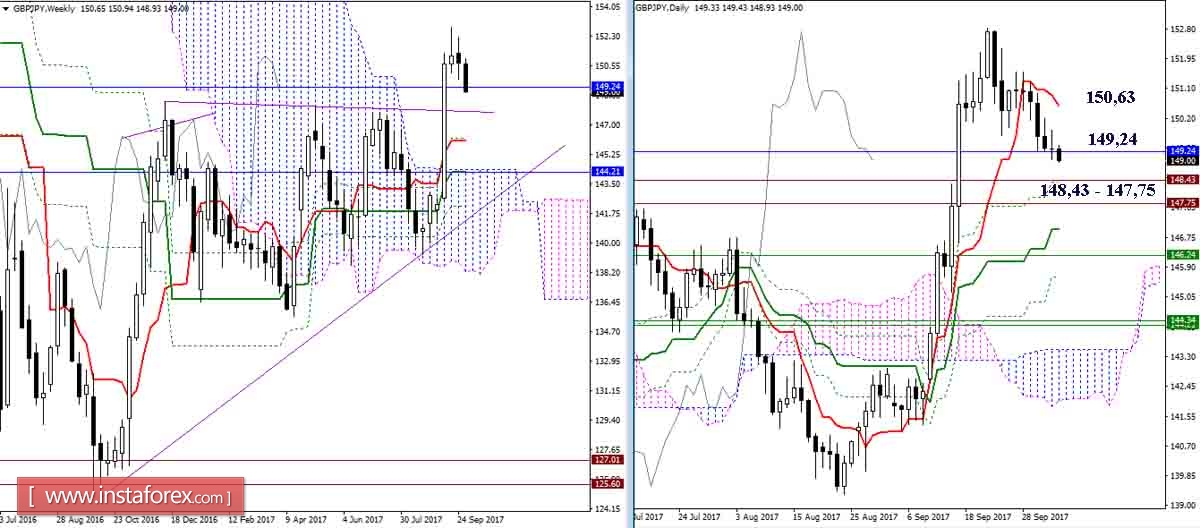
Players on the fall continue to struggle with the support of the monthly Fibo Kijun (149.24). The next downward direction continues to move towards the zone of the trend line and passed the maximum boundaries at the range of 148.43 - 147.75. The nearest resistance at the upper half is the daytime Tenkan and it moved down to 150.63 for today.
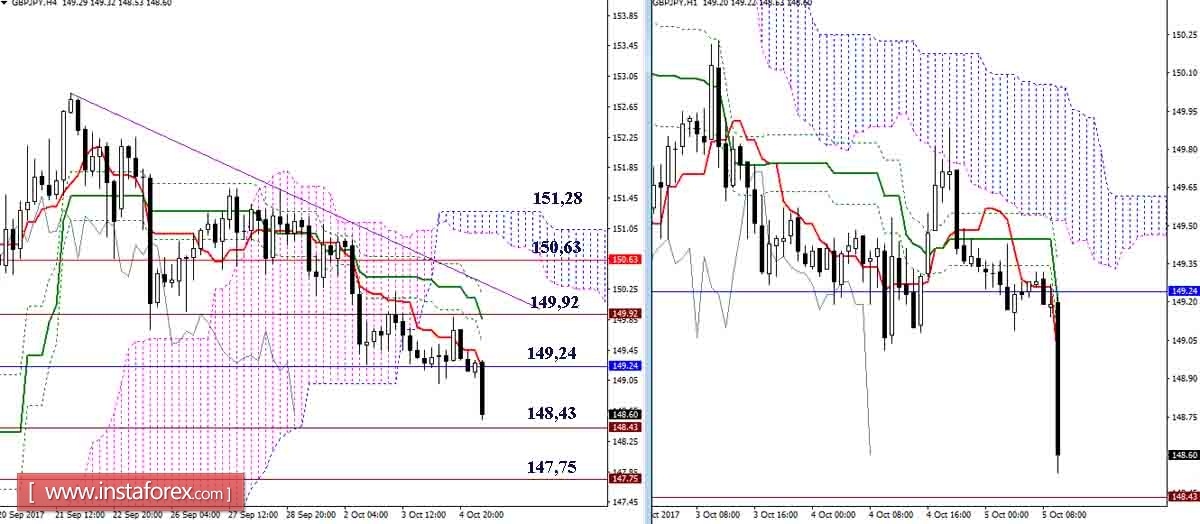
Yesterday, the expected upward correction was not very deep, even in the lower half. Once again, the players on the fall began to decline after the correction. Bears should note these levels for today: 148.43 - 147.75 - 147.00. On the other hand, resistance levels are found at these levels: 149.24 - 149.92 - 150.63 - 151.28.
EUR / JPY pair
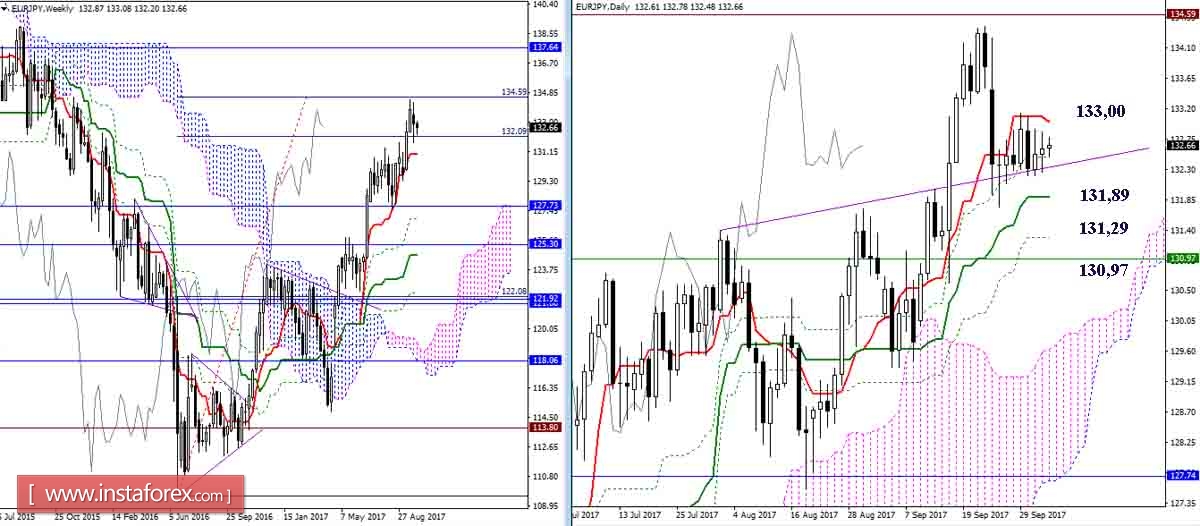
The pair remains in the consolidation zone. Despite the prerequisites, bears could not formalize the exit from the zone. In case of a decrease in the nearest support, the pair will be seen to positioning at cross - Kijun (131,89) and Fibo Kijun (131,29). The role of resistance still belongs to the day Tenkan (133,00).
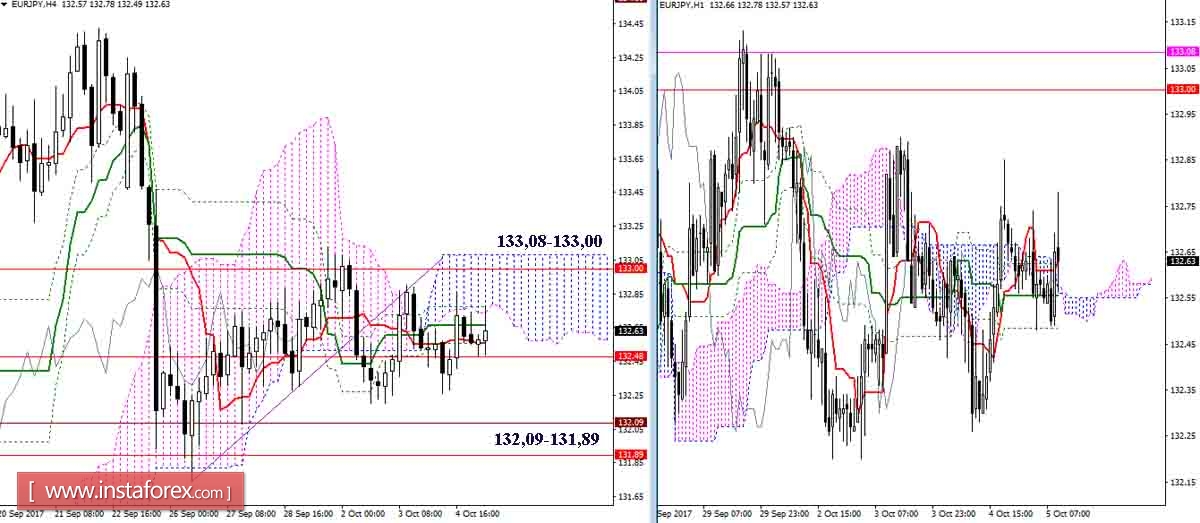
Everyday consolidation of the pair for a long-term has contributed to the emergence of lateral movements in the lower halves with the obvious signs such as swaying of the pair around the H1 cloud, the frequent change of the almost horizontal crosses of Ichimoku crosses and the lack of order in the formation of boundaries. In relation to the situation, this could assist fixing above the 133.00 - 08 (day Tenkan + Senkou Span B N4) or descend under 132.09 - 131,89 (the first target of the weekly goal + daily Kijun).
Indicator parameters:
all time intervals 9 - 26 - 52
The color of additional lines:
Tenkan (short-term trend) - red,
Kijun (medium-term trend) - green,
Fibo Kijun is a green dotted line,
Chikou is gray,
clouds: Senkou Span B (SSB, long-term trend) - blue,
Senkou Span A (SSA) - pink.
The color of additional lines:
support and resistance MN - blue, W1 - green, D1 - red, H4 - pink, H1 - gray,
horizontal levels (not Ichimoku) - brown,
trend lines - purple.