 English
  Русский
 Bahasa Indonesia
 Bahasa Malay
 ไทย
ไทย Español
 Deutsch
 Български
 Français
 Tiếng Việt
 中文
中文 বাংলা
বাংলা हिन्दी
 Čeština
 Українська
 Română

Further Development
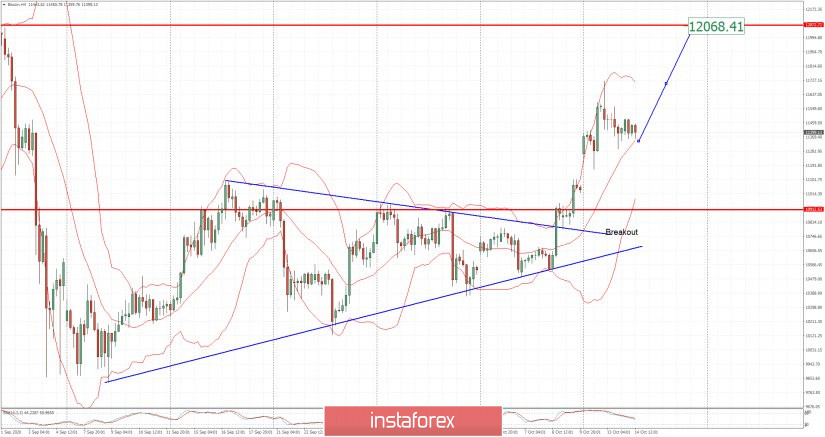
Analyzing the current trading chart of BTC, I found that buyers are still in control and that there is the bull flag pattern in creation based on the 4H time-frame.
My advice is to watch for potential buying opportunities with the take profit at the price of $12,000
The main cause of the most recent upside cycle on BTC was the breakout of the contraction and symmetrical triangle in the background.
Resistance: $12,000
Support level: $11,30