 English
  Русский
 Bahasa Indonesia
 Bahasa Malay
 ไทย
ไทย Español
 Deutsch
 Български
 Français
 Tiếng Việt
 中文
中文 বাংলা
বাংলা हिन्दी
 Čeština
 Українська
 Română

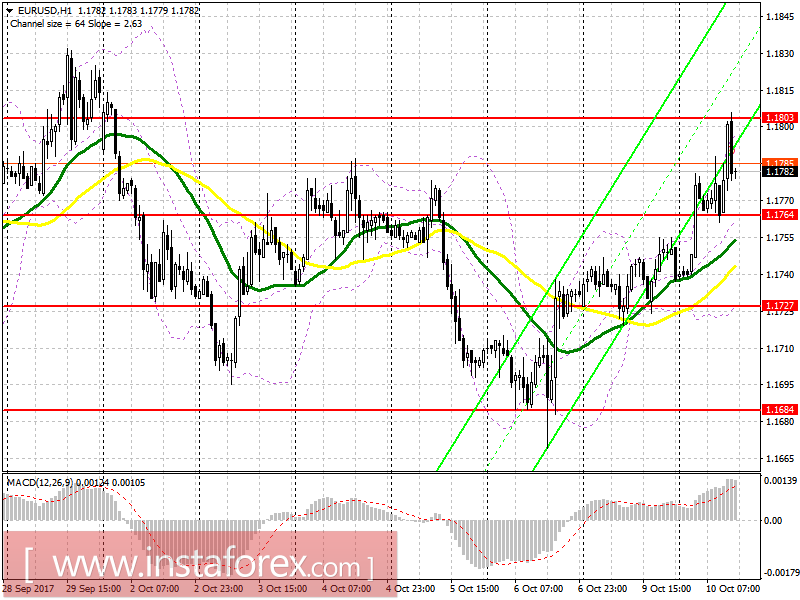
EUR / USD
To open long positions for EUR/USD, it is required:
It is best to open new long positions for the euro after updating the support level of 1.1764, which was formed in the first half of the day. The break and consolidation above 1.1803 will be an additional signal to increase purchases of the European currency with the purpose of updating to 1.1854, where I recommend fixing profits. If the euro falls below the level of 1.1764, it is best to go back to the purchases to rebound from 1.1727.
To open short positions for EUR/USD, it is required:
I recommend selling the euro only after the second growth in the resistance area of 1.1803 and the formation of a false breakdown there, or after consolidation under the level of 1.1764, which will lead to a downward trend in the support area of 1.1727, where it is best to record profit. In the case of growth above 1.1803, I recommend going back to short positions on the euro for a rebound from 1.1854.
GBP / USD
To open long positions for GBP/USD, it is required:
As long as the trade is above 1.3179, you can count on the continued growth of the pound in the resistance area of 1.3245, where I recommend fixing profits. If the pound drops below the level of 1.3179, opening new long positions is best for a rebound from the large support of 1.3107.
To open short positions for GBP/USD, it is required:
Sellers will try to return the pound to the level of 1.3179, which will increase the chance for short positions to increase in order to update the support level of 1.3107, where I recommend today to fix the profit. In the case of pound growth in the afternoon, pay attention to short positions is best for a rebound from the resistance of 1.3245.

Indicators
MA (average sliding) 50 days - yellow
MA (middle sliding) 30 days - green
MACD: fast EMA 12, slow EMA 26, SMA
Bollinger Bands 20