 English
  Русский
 Bahasa Indonesia
 Bahasa Malay
 ไทย
ไทย Español
 Deutsch
 Български
 Français
 Tiếng Việt
 中文
中文 বাংলা
বাংলা हिन्दी
 Čeština
 Українська
 Română

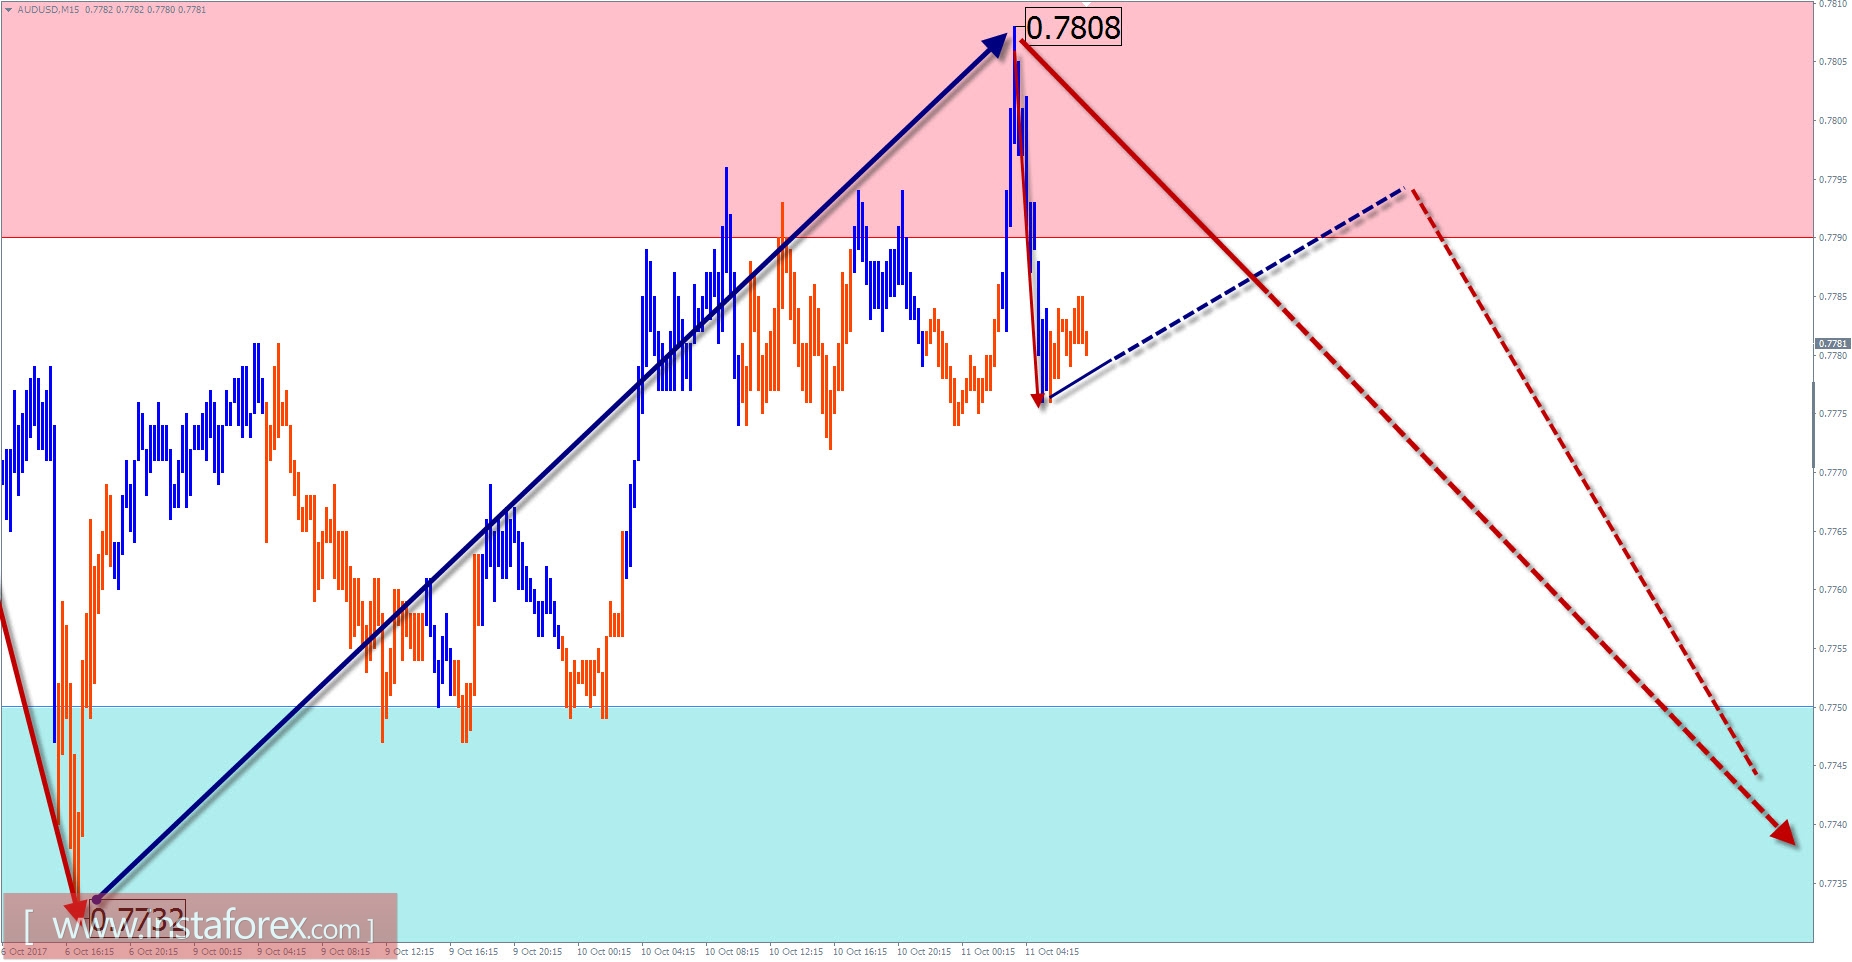
Overview of AUD / USD with the current day forecast
The upward wave, which has been dominant since last January on the chart of the major dollar pair of the Australian dollar, has reached the calculated elongation. The proportions of all parts of the wave are met. Last month, the price is at the bottom edge of the potential turn zone.
The direction of the short-term trend is set by a counter wave, leading from the end of July. The final phase of the movement (C) since September 8 moves the price of the pair down. By the current day, it has reached the minimum allowable size, after which the completion of the entire structure is possible. Turn signals at the time of analysis on the chart are not formed. From current levels, one can expect a corrective move with limited potential.
Today, the pair expects a common flatness tone. The European trading session does not exclude a short-term recovery. In the afternoon, the vector of the direction of movement should change to a descending one.
The boundaries of the zones of resistance:
- 0.7790 / 0.7820
The boundaries of the support zones:
- 0.7750 / 20
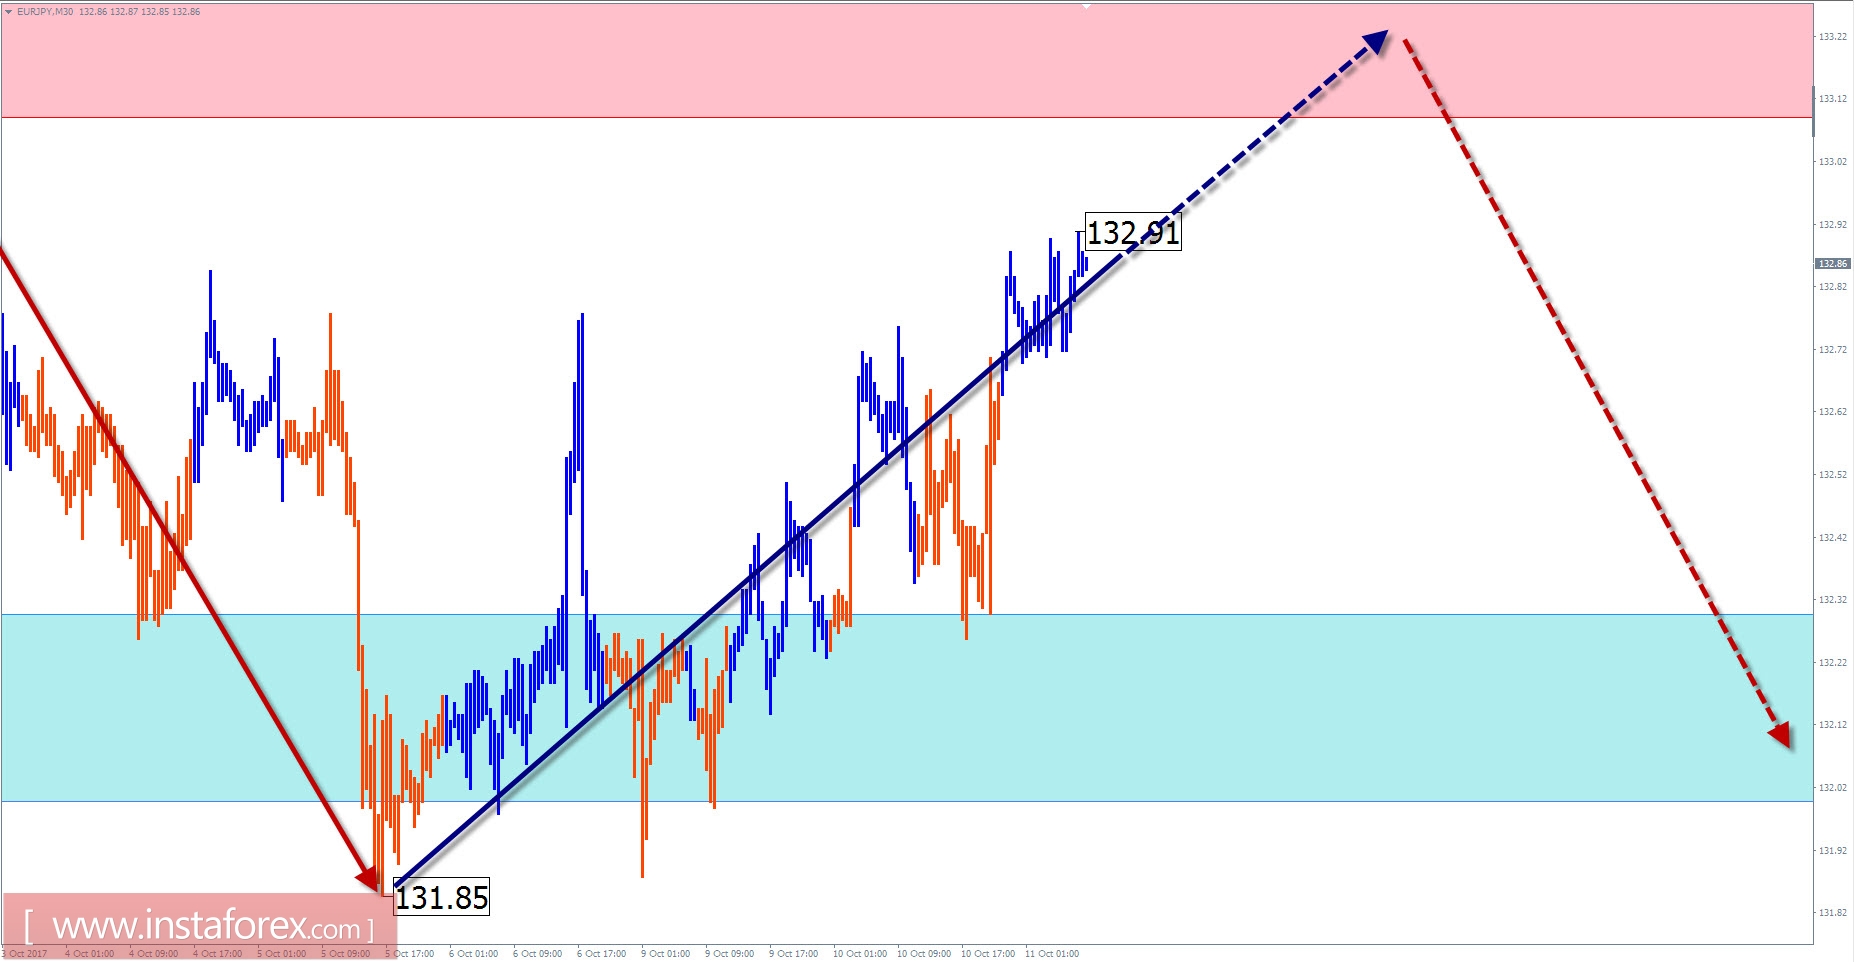
Overview of EUR / JPY with the forecast for the current day
Since April of this year, the direction of movement of this cross pair is set by an upward wave. In a larger wave model, this plot takes the place of the final part (C), which explains its impulsive nature.
Approaching the scale, from the middle of last month, it is possible to single out the last segment forming a corrective zigzag. During the last 2 weeks, the price in the flat corridor forms the middle part of the wave (B). After its completion, you can count on the final price jerk down.
Today, it is expected to continue the upward movement of the price, until its completion in the framework of the calculated resistance. Then you can count on the formation of the turn and the beginning of the course downward. The last stage is more likely in the second half of the day but may move on the next day.
The boundaries of the resistance zones:
- 133.10 / 40
The boundaries of the support zones:
- 132.30 / 132.00
Explanations to the figures: For simplified wave analysis, a simple waveform is used that combines 3 parts (A; B; C). Of these waves, all kinds of correction are composed and most of the impulses. On each considered time frame the last, incomplete wave is analyzed.
The areas marked on the graphs are indicated by the calculation areas in which the probability of a change in the direction of motion is significantly increased. Arrows indicate the wave counting according to the technique used by the author. The solid background of the arrows indicates the structure formed, the dotted one indicates the expected wave motion.
Attention: The wave algorithm does not take into account the duration of the tool movements in time. The forecast is not a trading signal! To conduct a trade transaction, you need to confirm the signals of your trading systems.