 English
  Русский
 Bahasa Indonesia
 Bahasa Malay
 ไทย
ไทย Español
 Deutsch
 Български
 Français
 Tiếng Việt
 中文
中文 বাংলা
বাংলা हिन्दी
 Čeština
 Українська
 Română

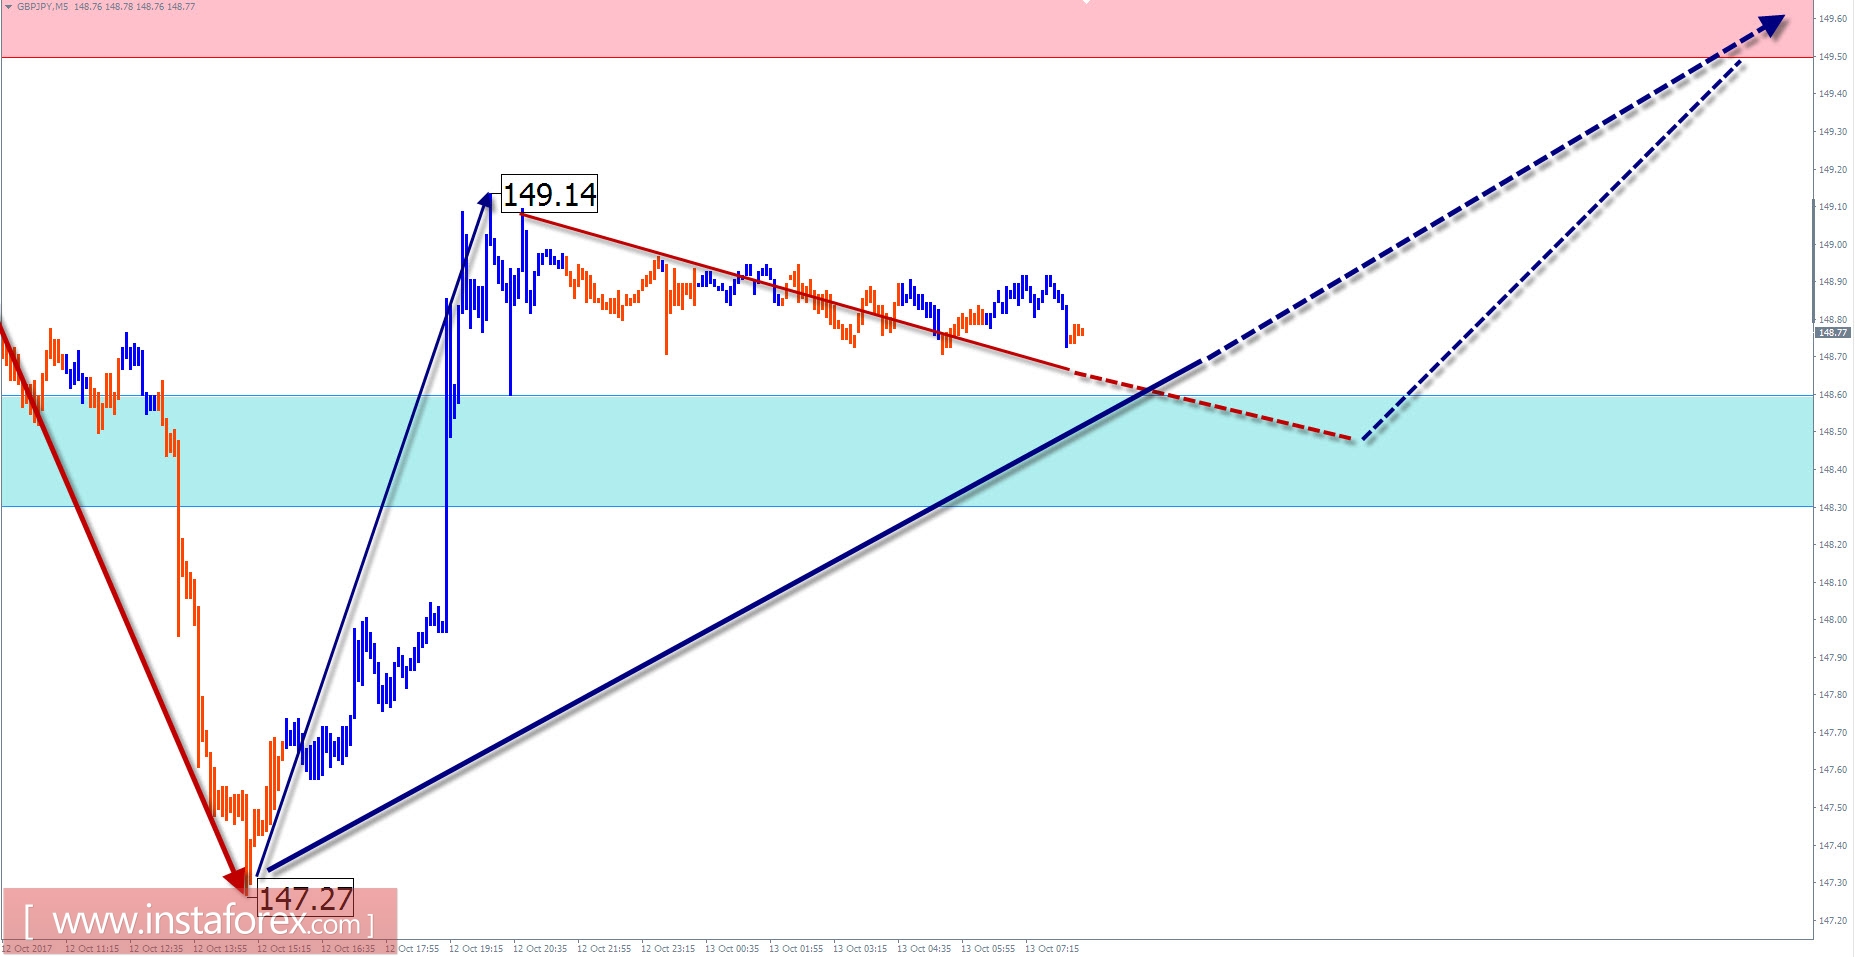
On the daily scale of the schedule of the cross pair British pound/yen since October last year, a clear graphic figure "ascending pennant" is formed. When analyzing the structure of this wave, we can note the limited potential for its growth. The quotations are near the lower limit of the calculation area of the potential reversal. The proportions of the parts of the current wave are formed.
The downward wave that began last month confirms expectations, as its wave level exceeds the rollback of the last part of the trend. A week ago, its correction began, in which, on the rise of news volatility, the middle part of the wave zigzag (B) was completed on one day and the final (C) was started.
Today, the completion of yesterday's recovery is expected. In the first half of the day, it is possible to eliminate the flattened mood of the pair's fluctuations, with a possible reduction to the support zone. The daily growth rate limits the resistance zone.
The boundaries of the zones of resistance:
- 149.50 / 80
The boundaries of the support zones:
- 148.60 / 30
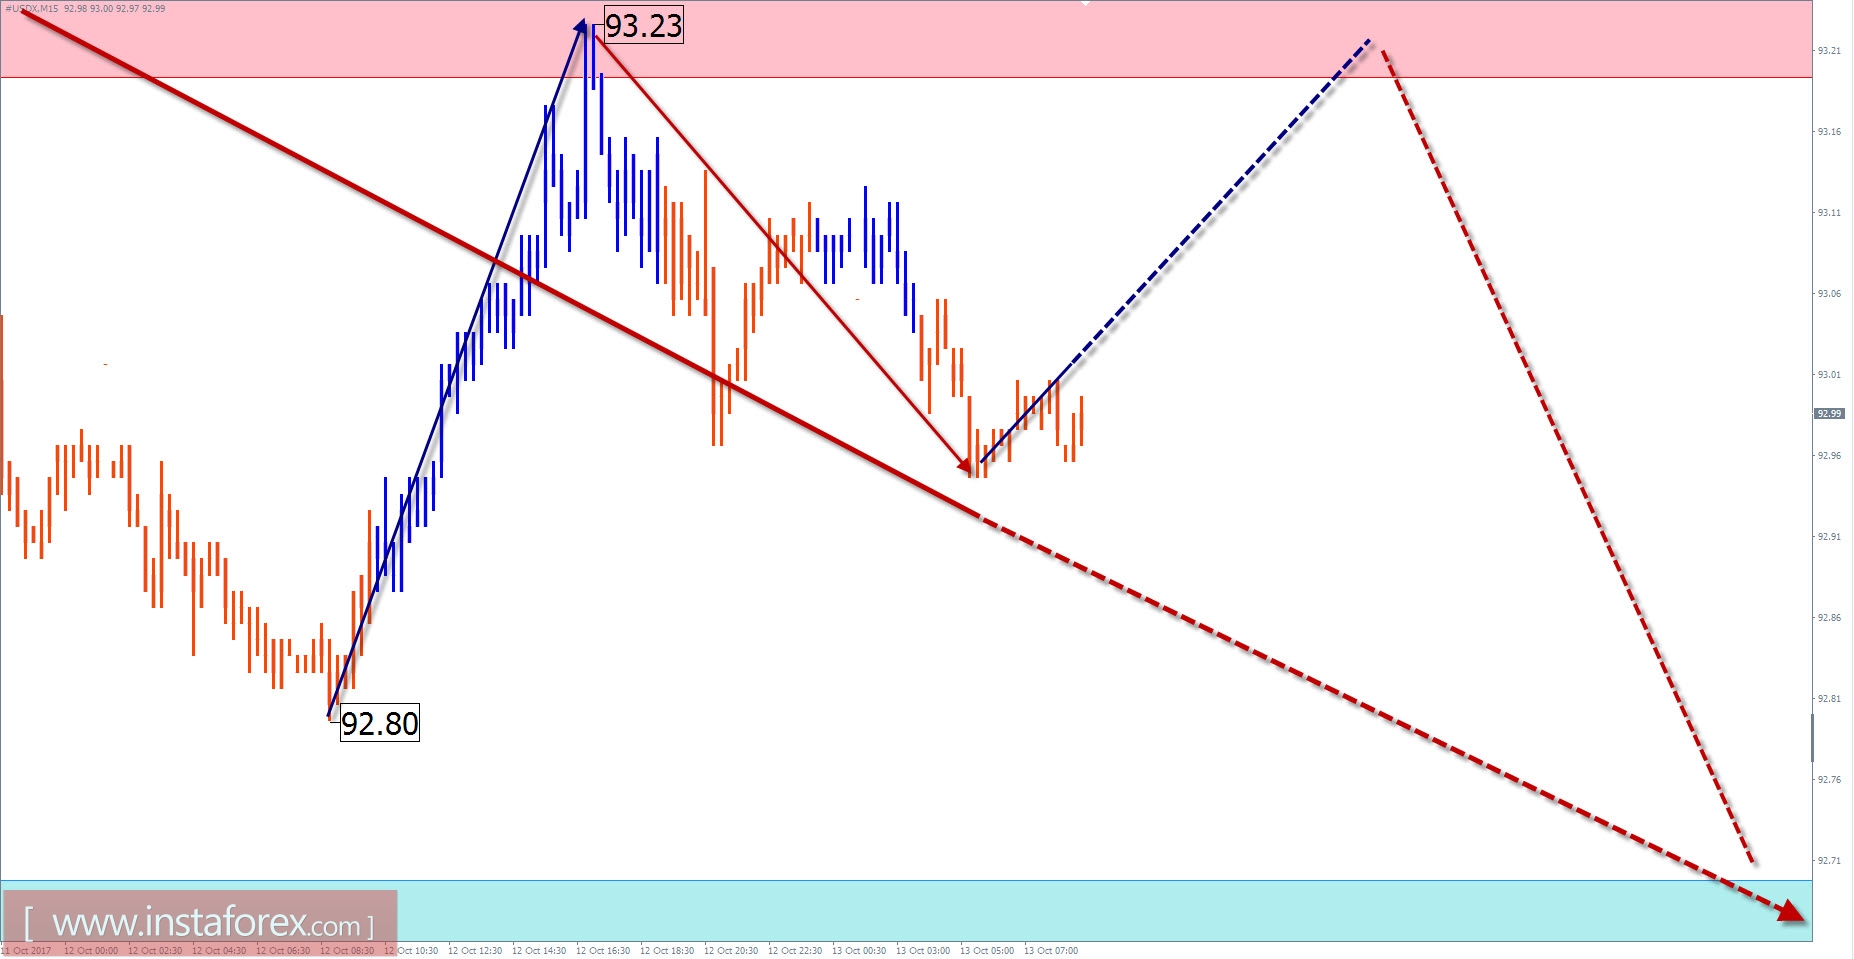
Overview of #USDX (US dollar index) with a forecast for the current day
On the daily scale of the chart of the US dollar index, the downward wave is dominant. In a larger wave model, it takes the place of the final part. The potential of the move down is not exhausted.
Since September 8, from the intermediate level of support for large-scale dollar quotations form a correction. Minimal recovery targets were achieved last week. The downward segment started on October 6 may be the first part (A) of the reversal pattern, preceding the return to the basic vector of the index movement.
Today, we expect a common flute tone. In the first half of the day, one can expect a short-term recovery of the course, not beyond the zone of resistance. Towards the end of the day, the probability of a downward spurt will sharply increase amid the increased volatility of the instrument.
The boundaries of the resistance zones:
- 93.20 / 30
The boundaries of the support zones:
- 92.70 / 60
Explanations to the figures: For simplified wave analysis, a simple waveform is used that combines 3 parts (A; B; C). Of these waves, all kinds of correction are composed and most of the impulses. On each considered time frame the last, incomplete wave is analyzed.
The areas marked on the graphs are indicated by the calculation areas in which the probability of a change in the direction of motion is significantly increased. Arrows indicate the wave counting according to the technique used by the author. The solid background of the arrows indicates the structure formed, the dotted one indicates the expected wave motion.
Attention: The wave algorithm does not take into account the duration of the tool movements in time. The forecast is not a trading signal! To conduct a trade transaction, you need to confirm the signals of your trading systems.