 English
  Русский
 Bahasa Indonesia
 Bahasa Malay
 ไทย
ไทย Español
 Deutsch
 Български
 Français
 Tiếng Việt
 中文
中文 বাংলা
বাংলা हिन्दी
 Čeština
 Українська
 Română

GBP/JPY
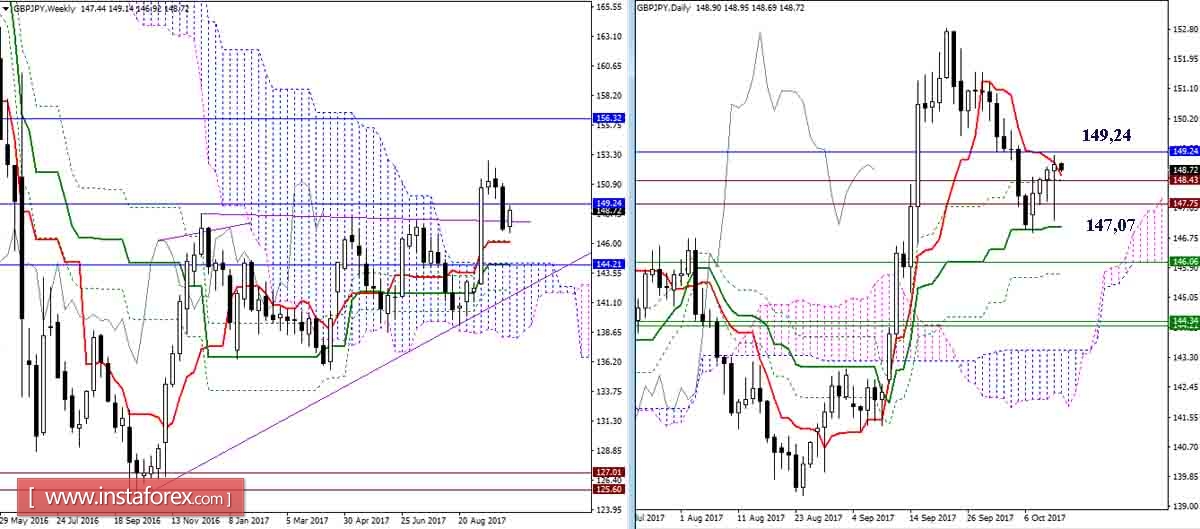
Yesterday, players lowered the reconnaissance battle but the result so far is only a long lower shadow. The pair returned to the resistance of the monthly Fibo Kijun (149.24), coming to the close of the week with the unrealized bearish potential of last week. The greatest value in the current situation continues to have the resistance level of 149.24 and support level of 147.07 (daytime Kijun).
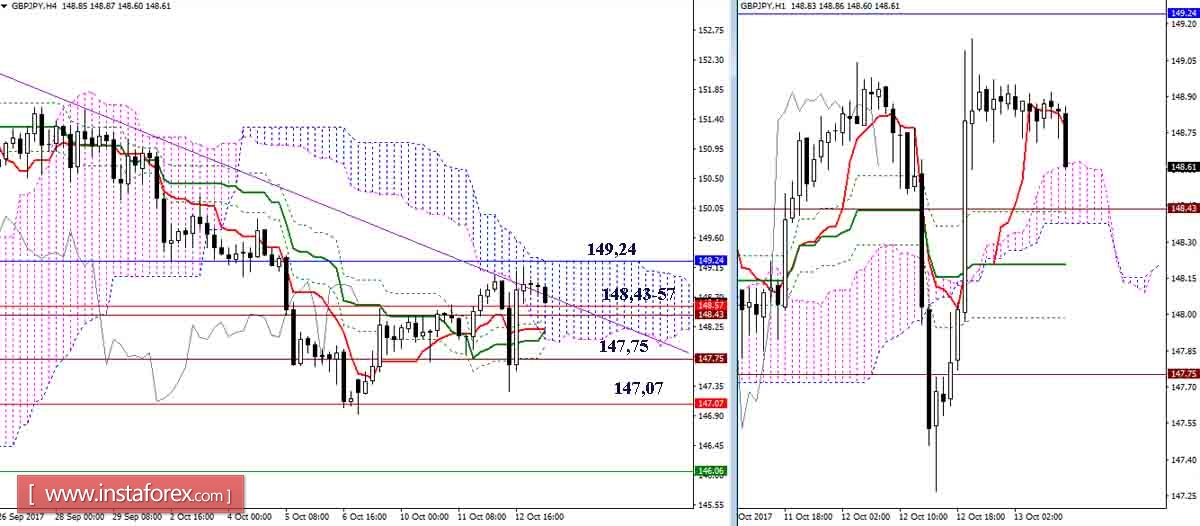
The pair returned to the uncertainty of the cloud H4. The breakdown of the H4 cloud, amplified by the monthly level (149.24), opens up new opportunities and prospects. As a result of overcoming the resistance of the upper boundary, a new upward target will be formed. The next testing supports, today it is 148,43-57 - 147,75 - 147,07, as well as consolidation under them, strengthens the mood of the bears, returning plans to continue the decline, whose benchmarks are the levels of the weekly cross (the nearest Tenkan 146.06).
EUR / JPY
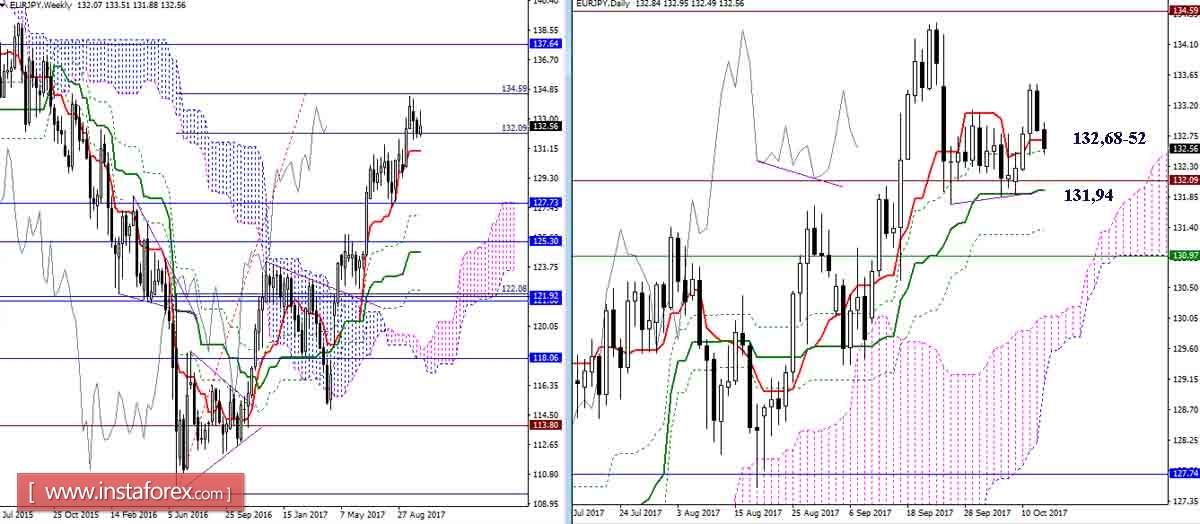
The pair returned to the consolidation zone and today is testing the initial boundaries of the day cross again for strength (Tenkan 132.68 + Fibo Kijun 132.52). The fastening below will most likely complete the rise and will open up opportunities for interaction with the daily Kijun (131.94), with the aim of breaking it and continuing the decline.
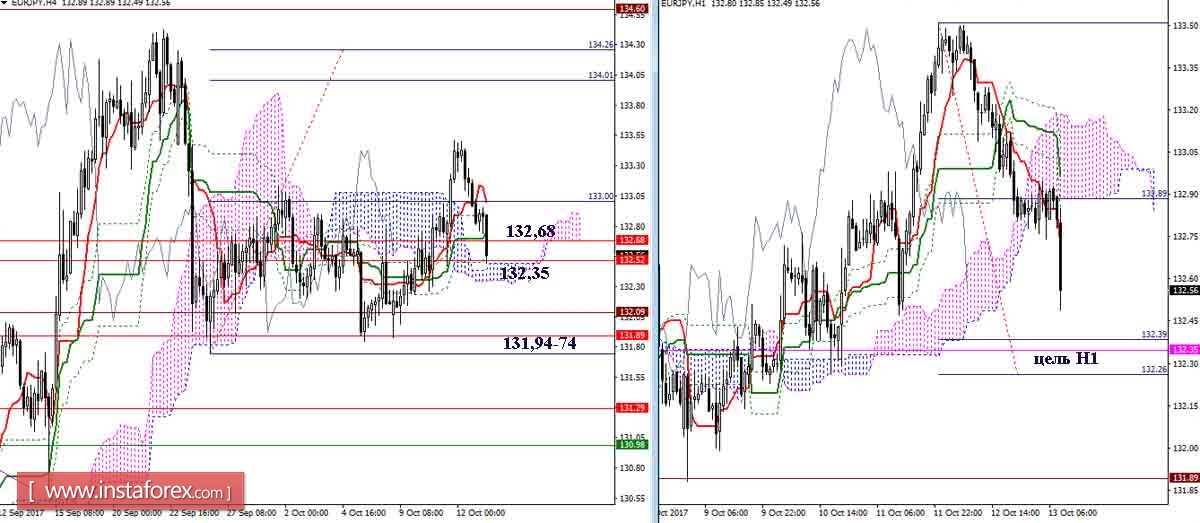
At the moment, the pair is at the center of the previous consolidation. The breakdown of the H4 cloud (132.35) and the completion (with subsequent overcoming) of the target at the breakdown of the H1 cloud will strengthen the long-term bearish sentiment and form a new downside target. The next most important milestone is 131,94-74 (daily Kijun + update minimum consolidation).
Indicator parameters:
All time intervals 9 - 26 - 52
The color of the indicator lines:
Tenkan (short-term trend) - red,
Kijun (medium-term trend) - green,
Fibo Kijun - green dotted line,
Chinkou - gray,
Clouds: Senkou Span B (SSB, long-term trend) - blue,
Senkou Span A (SSA) - pink.
The color of additional lines:
Support and resistance MN - blue, W1 - green, D1 - red, H4 - pink, H1 - gray,
Horizontal levels (not Ichimoku) - brown,
Trend lines - purple.