Analysis of wave counting:
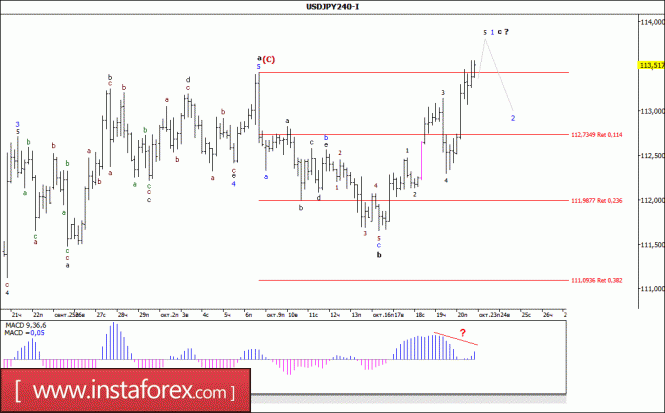
Starting the Friday's trading with the upward movement, the pair USD / JPY was able to add more than 100 pp in price and at the end of the day, it was fixed on the maximum reached on October 6. The wave situation that develops in this case allows us to assume that after completing October 16, wave b, (C), the currency pair has moved to the stage of formation of the future wave c, (C), in which its internal 1st wave has already taken the form of a full five-wave structure. If this is the case, then from the maximum reached on the last day of last week, or slightly higher, the currency pair may begin a correction decrease, thereby indicating the beginning of the 2nd wave, c, (C).
Targets for the downward wave option:
112.50 - 113.00
Targets for the upward wave option:
113.53 - 38.2% of Fibonacci
115.00 - 117.00
General conclusions and trading recommendations:
The instrument continues to complicate its wave structure, which may require the introduction of additions and adjustments at any time. Now, the construction of the wave (C), its internal wave c, continues, with the goals located between 115 and 117 figures. The internal wave b, (C) is most likely, completed. A small MACD divergence warns about a possible withdrawal of quotations from the reached maximums within the wave 2, c, (C).
 English
 Русский
 Bahasa Indonesia
 Bahasa Malay
 ไทย
ไทย Español
 Deutsch
 Български
 Français
 Tiếng Việt
 中文
中文 বাংলা
বাংলা हिन्दी
 Čeština
 Українська
 Română

