 English
  Русский
 Bahasa Indonesia
 Bahasa Malay
 ไทย
ไทย Español
 Deutsch
 Български
 Français
 Tiếng Việt
 中文
中文 বাংলা
বাংলা हिन्दी
 Čeština
 Українська
 Română

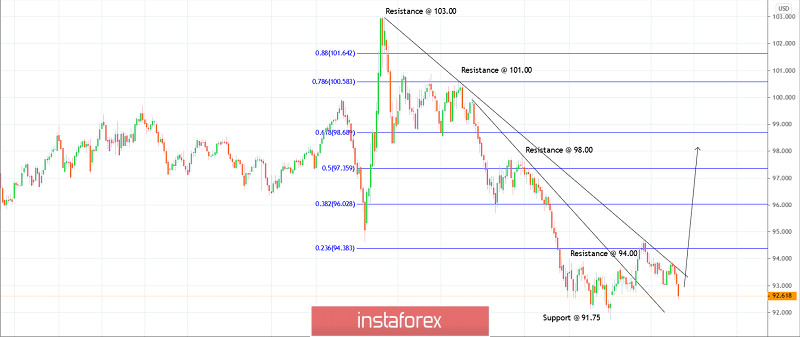
Technical outlook:
US Dollar Index had dropped through 92.35/40 potential support zone yesterday, before pulling back. The end of the day chart has been presented here and it is seen to be trading around 92.72 at this point in writing. Please note that the indice had dropped through 92.35/40, which is also fibonacci 0.786 retracement of the rally between 91.75 and 94.75 respectively. Bulls are expected to remain in control until prices stay above 91.75 levels, going forward. Immediate support is seen at 91.75, while resistance is fixed around 94.75 levels respectively. The upside potential remains towards 96.00 and 98.00 respectively and a push above 94.75 will accelerate. Also note that 98.00 is fibonacci 0.618 retracement of the entire drop between 103.00 and 91.75 respectively, hence high probability remains for a bearish bounce.
Trading plan:
Remain long, stop @ 91.75, target is 96.00 and 98.00
Good luck!