Gold price is trapped between the kijun-sen and the tenkan-sen indicators. Although longer-term trend in Ichimoku cloud terms remains bullish, there are some worrying signs that a bigger pull back could unfold until the end of the year.
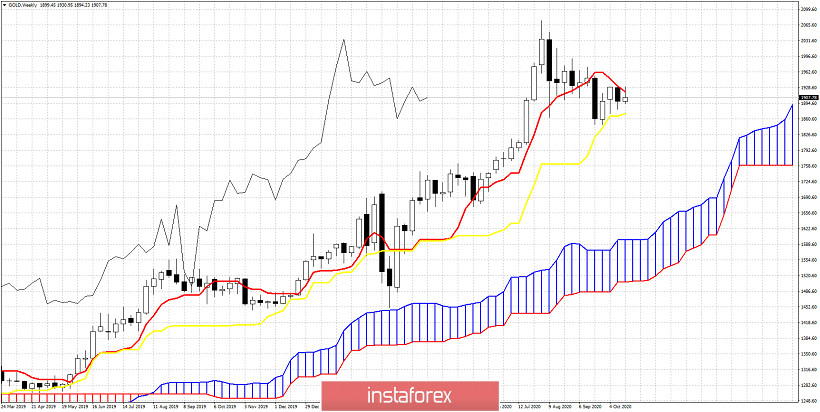
Gold price is well above the Kumo (cloud). Price is getting rejected the last two weeks at the tenkan-sen (red line indicator). This is a sign of weakness. The tenkan-sen resistance is now at $1,920. Bulls need a weekly close above $1,920. On the other hand bears are not that strong either as price has tested the kijun-sen (yellow line indicator) and have not managed to break below it yet. Support by the kijun-sen is at $1,872. A weekly close below $1,872 is what bears look for. This will imply that a move towards the cloud at $1,650-$1,700 would be likely. The Chikou span (black line indicator) is above the candlestick pattern. Support according to the Chikou span on a weekly basis is at $1,730-$1,760.
*The market analysis posted here is meant to increase your awareness, but not to give instructions to make a trade
 English
  Русский
 Bahasa Indonesia
 Bahasa Malay
 ไทย
ไทย Español
 Deutsch
 Български
 Français
 Tiếng Việt
 中文
中文 বাংলা
বাংলা हिन्दी
 Čeština
 Українська
 Română
 Long-term review